APS 2013 Annual Report Download - page 51
Download and view the complete annual report
Please find page 51 of the 2013 APS annual report below. You can navigate through the pages in the report by either clicking on the pages listed below, or by using the keyword search tool below to find specific information within the annual report.-
 1
1 -
2
-
3
-
4
-
5
-
6
-
7
-
8
-
9
-
10
-
11
-
12
-
13
-
14
-
15
-
16
-
17
-
18
-
19
-
20
-
21
-
22
-
23
-
24
-
25
-
26
-
27
-
28
-
29
-
30
-
31
-
32
-
33
-
34
-
35
-
36
-
37
-
38
-
39
-
40
-
 41
41 -
 42
42 -
 43
43 -
 44
44 -
 45
45 -
 46
46 -
 47
47 -
 48
48 -
 49
49 -
 50
50 -
 51
51 -
 52
52 -
 53
53 -
 54
54 -
 55
55 -
 56
56 -
 57
57 -
 58
58 -
 59
59 -
 60
60 -
 61
61 -
62
-
63
-
64
-
65
-
66
-
67
-
68
-
69
-
70
-
71
-
72
-
73
-
74
-
75
-
76
-
77
-
78
-
79
-
80
-
81
-
82
-
83
-
84
-
85
-
86
-
87
-
88
-
89
-
90
-
91
-
92
-
93
-
94
-
95
-
96
-
97
-
98
-
99
-
100
-
101
-
102
-
103
-
104
-
105
-
106
-
107
-
108
-
109
-
110
-
111
-
112
-
113
-
114
-
115
-
116
-
117
-
118
-
119
-
120
-
121
-
122
-
123
-
124
-
125
-
126
-
127
-
128
-
129
-
130
-
131
-
132
-
133
-
134
-
135
-
136
-
137
-
138
-
139
-
140
-
141
-
142
-
143
-
144
-
145
-
146
-
147
-
148
-
149
-
150
-
151
-
152
-
153
-
154
-
155
-
156
-
157
-
158
-
159
-
160
-
161
-
162
-
163
-
164
-
165
-
166
-
167
-
168
-
169
-
170
-
171
-
172
-
173
-
174
-
175
-
176
-
177
-
178
-
179
-
180
-
181
-
182
-
183
-
184
-
185
-
186
-
187
-
188
-
189
-
190
-
191
-
192
-
193
-
194
-
195
-
196
-
197
-
198
-
199
-
200
-
201
-
202
-
203
-
204
-
205
-
206
-
207
-
208
-
209
-
210
-
211
-
212
-
213
-
214
-
215
-
216
-
217
-
218
-
219
-
220
-
221
-
222
-
223
-
224
-
225
-
226
-
227
-
228
-
229
-
230
-
231
-
232
-
233
-
234
-
235
-
236
-
237
-
238
-
239
-
240
-
241
-
242
-
243
-
244
-
245
-
246
-
247
-
248
-
249
-
250
-
251
-
252
-
253
-
254
-
255
-
256
-
257
-
258
-
259
-
260
-
261
-
262
-
263
-
264
-
265
-
266
 |
 |
Table of Contents
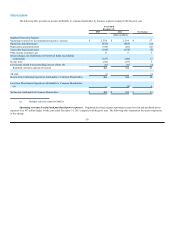
SELECTED FINANCIAL DATA
ARIZONA PUBLIC SERVICE COMPANY – CONSOLIDATED
2013 2012 2011 2010 2009
(dollars in thousands)
OPERATING RESULTS
Electric operating revenues $3,451,251 $3,293,489 $3,237,241 $3,180,807 $ 3,149,500
Fuel and purchased power costs 1,095,709 994,790 1,009,464 1,046,815 1,178,620
Other operating expenses 1,733,677 1,693,170 1,673,394 1,584,955 1,501,081
Operating income 621,865 605,529 554,383 549,037 469,799
Other income 20,797 16,358 24,974 20,138 13,893
Interest expense — net of allowance for borrowed funds 183,801 194,777 215,584 213,349 213,258
Net income 458,861 427,110 363,773 355,826 270,434
Less: Net income attributable to noncontrolling interests 33,892 31,613 27,524 20,163 19,209
Net income attributable to common shareholder $424,969 $395,497 $ 336,249 $ 335,663 $251,225
BALANCE SHEET DATA
Total assets $13,381,377 $ 13,242,542 $ 13,032,237 $12,271,877 $11,730,500
Liabilities and equity:
Total equity $4,454,874 $4,222,483 $ 4,051,406 $ 3,916,037 $3,527,679
Long-term debt less current maturities 2,671,465 3,074,088 2,894,054 3,045,794 3,306,406
Total capitalization 7,126,339 7,296,571 6,945,460 6,961,831 6,834,085
Current liabilities 1,580,847 1,043,087 1,322,714 1,234,865 1,070,970
Deferred credits and other 4,674,191 4,902,884 4,764,063 4,075,181 3,825,445
Total liabilities and equity $13,381,377 $ 13,242,542 $ 13,032,237 $12,271,877 $11,730,500
48