APS 2013 Annual Report Download - page 150
Download and view the complete annual report
Please find page 150 of the 2013 APS annual report below. You can navigate through the pages in the report by either clicking on the pages listed below, or by using the keyword search tool below to find specific information within the annual report.-
 1
1 -
2
-
3
-
4
-
5
-
6
-
7
-
8
-
9
-
10
-
11
-
12
-
13
-
14
-
15
-
16
-
17
-
18
-
19
-
20
-
21
-
22
-
23
-
24
-
25
-
26
-
27
-
28
-
29
-
30
-
31
-
32
-
33
-
34
-
35
-
36
-
37
-
38
-
39
-
40
-
41
-
42
-
43
-
44
-
45
-
46
-
47
-
48
-
49
-
50
-
51
-
52
-
53
-
54
-
55
-
56
-
57
-
58
-
59
-
60
-
61
-
62
-
63
-
64
-
65
-
66
-
67
-
68
-
69
-
70
-
71
-
72
-
73
-
74
-
75
-
76
-
77
-
78
-
79
-
80
-
81
-
82
-
83
-
84
-
85
-
86
-
87
-
88
-
89
-
90
-
91
-
92
-
93
-
94
-
95
-
96
-
97
-
98
-
99
-
100
-
101
-
102
-
103
-
104
-
105
-
106
-
107
-
108
-
109
-
110
-
111
-
112
-
113
-
114
-
115
-
116
-
117
-
118
-
119
-
120
-
121
-
122
-
123
-
124
-
125
-
126
-
127
-
128
-
129
-
130
-
131
-
132
-
133
-
134
-
135
-
136
-
137
-
138
-
139
-
 140
140 -
 141
141 -
 142
142 -
 143
143 -
 144
144 -
 145
145 -
 146
146 -
 147
147 -
 148
148 -
 149
149 -
 150
150 -
 151
151 -
 152
152 -
 153
153 -
 154
154 -
 155
155 -
 156
156 -
 157
157 -
 158
158 -
 159
159 -
 160
160 -
161
-
162
-
163
-
164
-
165
-
166
-
167
-
168
-
169
-
170
-
171
-
172
-
173
-
174
-
175
-
176
-
177
-
178
-
179
-
180
-
181
-
182
-
183
-
184
-
185
-
186
-
187
-
188
-
189
-
190
-
191
-
192
-
193
-
194
-
195
-
196
-
197
-
198
-
199
-
200
-
201
-
202
-
203
-
204
-
205
-
206
-
207
-
208
-
209
-
210
-
211
-
212
-
213
-
214
-
215
-
216
-
217
-
218
-
219
-
220
-
221
-
222
-
223
-
224
-
225
-
226
-
227
-
228
-
229
-
230
-
231
-
232
-
233
-
234
-
235
-
236
-
237
-
238
-
239
-
240
-
241
-
242
-
243
-
244
-
245
-
246
-
247
-
248
-
249
-
250
-
251
-
252
-
253
-
254
-
255
-
256
-
257
-
258
-
259
-
260
-
261
-
262
-
263
-
264
-
265
-
266
 |
 |
Table of Contents
PINNACLE WEST CAPITAL CORPORATION
NOTES TO CONSOLIDATED FINANCIAL STATEMENTS
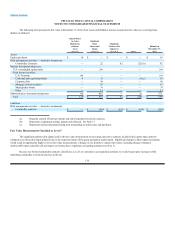
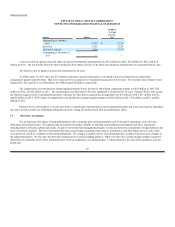
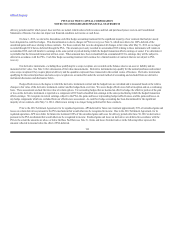
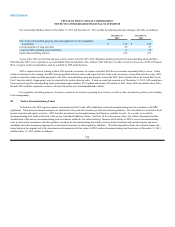
The following table provides information about gains and losses from derivative instruments not designated as accounting hedging instruments
during the years ended December 31, 2013, 2012 and 2011 (dollars in thousands):
Year Ended
Financial Statement December 31,
Commodity Contracts Location 2013 2012 2011
Net Gain (Loss)
Recognized in Income Operating revenues (a) $289 $103 $(27)
Net Loss Recognized in
Income
Fuel and purchased power
(a) (10,449)(2,747)(52,113)
Total $(10,160)$(2,644)$(52,140)
(a) Amounts are before the effect of PSA deferrals.
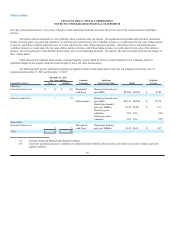
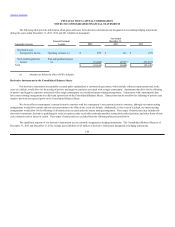
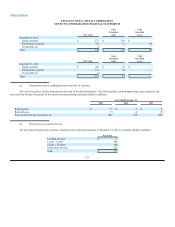
Derivative Instruments in the Consolidated Balance Sheets
Our derivative transactions are typically executed under standardized or customized agreements, which include collateral requirements and, in the
event of a default, would allow for the netting of positive and negative exposures associated with a single counterparty. Agreements that allow for the offsetting
of positive and negative exposures associated with a single counterparty are considered master netting arrangements. Transactions with counterparties that
have master netting arrangements are offset and reported net on the Consolidated Balance Sheets. Transactions that do not allow for offsetting of positive and
negative positions are reported gross on the Consolidated Balance Sheets.
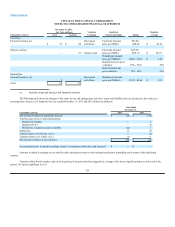
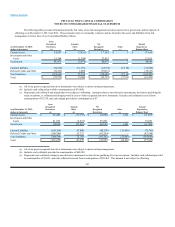
We do not offset a counterparty’s current derivative contracts with the counterparty’s non-current derivative contracts, although our master netting
arrangements would allow current and non-current positions to be offset in the event of a default. Additionally, in the event of a default, our master netting
arrangements would allow for the offsetting of all transactions executed under the master netting arrangement. These types of transactions may include non-
derivative instruments, derivatives qualifying for scope exceptions, trade receivables and trade payables arising from settled positions, and other forms of non-
cash collateral (such as letters of credit). These types of transactions are excluded from the offsetting tables presented below.
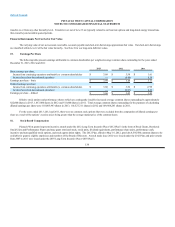
The significant majority of our derivative instruments are not currently designated as hedging instruments. The Consolidated Balance Sheets as of
December 31, 2013 and December 31, 2012, include gross liabilities of $5 million of derivative instruments designated as hedging instruments.
146