APS 2013 Annual Report Download - page 151
Download and view the complete annual report
Please find page 151 of the 2013 APS annual report below. You can navigate through the pages in the report by either clicking on the pages listed below, or by using the keyword search tool below to find specific information within the annual report.-
 1
1 -
2
-
3
-
4
-
5
-
6
-
7
-
8
-
9
-
10
-
11
-
12
-
13
-
14
-
15
-
16
-
17
-
18
-
19
-
20
-
21
-
22
-
23
-
24
-
25
-
26
-
27
-
28
-
29
-
30
-
31
-
32
-
33
-
34
-
35
-
36
-
37
-
38
-
39
-
40
-
41
-
42
-
43
-
44
-
45
-
46
-
47
-
48
-
49
-
50
-
51
-
52
-
53
-
54
-
55
-
56
-
57
-
58
-
59
-
60
-
61
-
62
-
63
-
64
-
65
-
66
-
67
-
68
-
69
-
70
-
71
-
72
-
73
-
74
-
75
-
76
-
77
-
78
-
79
-
80
-
81
-
82
-
83
-
84
-
85
-
86
-
87
-
88
-
89
-
90
-
91
-
92
-
93
-
94
-
95
-
96
-
97
-
98
-
99
-
100
-
101
-
102
-
103
-
104
-
105
-
106
-
107
-
108
-
109
-
110
-
111
-
112
-
113
-
114
-
115
-
116
-
117
-
118
-
119
-
120
-
121
-
122
-
123
-
124
-
125
-
126
-
127
-
128
-
129
-
130
-
131
-
132
-
133
-
134
-
135
-
136
-
137
-
138
-
139
-
140
-
 141
141 -
 142
142 -
 143
143 -
 144
144 -
 145
145 -
 146
146 -
 147
147 -
 148
148 -
 149
149 -
 150
150 -
 151
151 -
 152
152 -
 153
153 -
 154
154 -
 155
155 -
 156
156 -
 157
157 -
 158
158 -
 159
159 -
 160
160 -
 161
161 -
162
-
163
-
164
-
165
-
166
-
167
-
168
-
169
-
170
-
171
-
172
-
173
-
174
-
175
-
176
-
177
-
178
-
179
-
180
-
181
-
182
-
183
-
184
-
185
-
186
-
187
-
188
-
189
-
190
-
191
-
192
-
193
-
194
-
195
-
196
-
197
-
198
-
199
-
200
-
201
-
202
-
203
-
204
-
205
-
206
-
207
-
208
-
209
-
210
-
211
-
212
-
213
-
214
-
215
-
216
-
217
-
218
-
219
-
220
-
221
-
222
-
223
-
224
-
225
-
226
-
227
-
228
-
229
-
230
-
231
-
232
-
233
-
234
-
235
-
236
-
237
-
238
-
239
-
240
-
241
-
242
-
243
-
244
-
245
-
246
-
247
-
248
-
249
-
250
-
251
-
252
-
253
-
254
-
255
-
256
-
257
-
258
-
259
-
260
-
261
-
262
-
263
-
264
-
265
-
266
 |
 |

Table of Contents
PINNACLE WEST CAPITAL CORPORATION
NOTES TO CONSOLIDATED FINANCIAL STATEMENTS
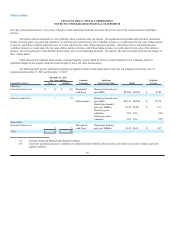
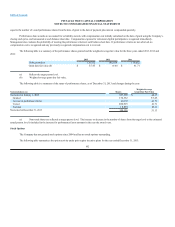
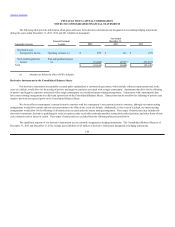
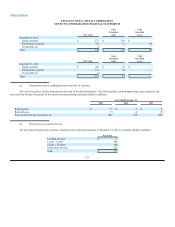
The following tables provide information about the fair value of our risk management activities reported on a gross basis, and the impacts of
offsetting as of December 31, 2013 and 2012. These amounts relate to commodity contracts and are located in the assets and liabilities from risk
management activities lines of our Consolidated Balance Sheets.
As of December 31, 2013:
(dollars in thousands)
Gross
Recognized
Derivatives
(a)
Amounts
Offset
(b)
Net
Recognized
Derivatives
Other
(c)
Amount
Reported on
Balance Sheet
Current Assets $24,587 $ (7,425) $ 17,162 $ 7 $ 17,169
Investments and Other
Assets 25,364 (1,549)23,815 —23,815
Total Assets 49,951 (8,974) 40,977 7 40,984
Current Liabilities (50,540)26,166 (24,374)(7,518) (31,892)
Deferred Credits and Other (72,123) 1,808 (70,315) — (70,315)
Total Liabilities (122,663)27,974 (94,689)(7,518)(102,207)
Total $ (72,712)$19,000 $ (53,712)$(7,511)$ (61,223)
(a) All of our gross recognized derivative instruments were subject to master netting arrangements.
(b) Includes cash collateral provided to counterparties of $19,000.
(c) Represents cash collateral and margin that is not subject to offsetting. Amounts relate to non-derivative instruments, derivatives qualifying for
scope exceptions, or collateral and margin posted in excess of the recognized derivative instrument. Includes cash collateral received from
counterparties of $7,518, and cash margin provided to counterparties of $7.
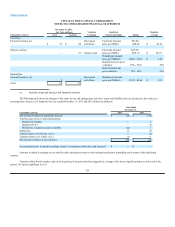
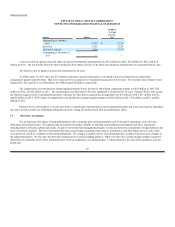
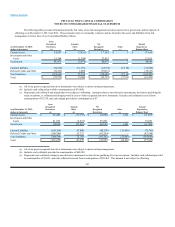
As of December 31, 2012:
(dollars in thousands)
Gross
Recognized
Derivatives
(a)
Amounts
Offset
(b)
Net
Recognized
Derivatives
Other
(c)
Amount
Reported on
Balance Sheet
Current Assets $42,495 $(17,797) $ 24,698 $1,001 $25,699
Investments and Other
Assets 41,563 (5,672)35,891 —35,891
Total Assets 84,058 (23,469) 60,589 1,001 61,590
Current Liabilities (105,324)57,046 (48,278) (25,463) (73,741)
Deferred Credits and Other (100,986) 15,722 (85,264) — (85,264)
Total Liabilities (206,310)72,768 (133,542) (25,463) (159,005)
Total $(122,252)$49,299 $(72,953)$(24,462)$(97,415)
(a) All of our gross recognized derivative instruments were subject to master netting arrangements.
(b) Includes cash collateral provided to counterparties of $49,299.
(c) Represents cash collateral relating to non-derivative instruments or derivatives qualifying for scope exceptions. Includes cash collateral provided
to counterparties of $1,001, and cash collateral received from counterparties of $25,463. This amount is not subject to offsetting.
147