APS 2013 Annual Report Download - page 96
Download and view the complete annual report
Please find page 96 of the 2013 APS annual report below. You can navigate through the pages in the report by either clicking on the pages listed below, or by using the keyword search tool below to find specific information within the annual report.-
 1
1 -
2
-
3
-
4
-
5
-
6
-
7
-
8
-
9
-
10
-
11
-
12
-
13
-
14
-
15
-
16
-
17
-
18
-
19
-
20
-
21
-
22
-
23
-
24
-
25
-
26
-
27
-
28
-
29
-
30
-
31
-
32
-
33
-
34
-
35
-
36
-
37
-
38
-
39
-
40
-
41
-
42
-
43
-
44
-
45
-
46
-
47
-
48
-
49
-
50
-
51
-
52
-
53
-
54
-
55
-
56
-
57
-
58
-
59
-
60
-
61
-
62
-
63
-
64
-
65
-
66
-
67
-
68
-
69
-
70
-
71
-
72
-
73
-
74
-
75
-
76
-
77
-
78
-
79
-
80
-
81
-
82
-
83
-
84
-
85
-
 86
86 -
 87
87 -
 88
88 -
 89
89 -
 90
90 -
 91
91 -
 92
92 -
 93
93 -
 94
94 -
 95
95 -
 96
96 -
 97
97 -
 98
98 -
 99
99 -
 100
100 -
 101
101 -
 102
102 -
 103
103 -
 104
104 -
 105
105 -
 106
106 -
107
-
108
-
109
-
110
-
111
-
112
-
113
-
114
-
115
-
116
-
117
-
118
-
119
-
120
-
121
-
122
-
123
-
124
-
125
-
126
-
127
-
128
-
129
-
130
-
131
-
132
-
133
-
134
-
135
-
136
-
137
-
138
-
139
-
140
-
141
-
142
-
143
-
144
-
145
-
146
-
147
-
148
-
149
-
150
-
151
-
152
-
153
-
154
-
155
-
156
-
157
-
158
-
159
-
160
-
161
-
162
-
163
-
164
-
165
-
166
-
167
-
168
-
169
-
170
-
171
-
172
-
173
-
174
-
175
-
176
-
177
-
178
-
179
-
180
-
181
-
182
-
183
-
184
-
185
-
186
-
187
-
188
-
189
-
190
-
191
-
192
-
193
-
194
-
195
-
196
-
197
-
198
-
199
-
200
-
201
-
202
-
203
-
204
-
205
-
206
-
207
-
208
-
209
-
210
-
211
-
212
-
213
-
214
-
215
-
216
-
217
-
218
-
219
-
220
-
221
-
222
-
223
-
224
-
225
-
226
-
227
-
228
-
229
-
230
-
231
-
232
-
233
-
234
-
235
-
236
-
237
-
238
-
239
-
240
-
241
-
242
-
243
-
244
-
245
-
246
-
247
-
248
-
249
-
250
-
251
-
252
-
253
-
254
-
255
-
256
-
257
-
258
-
259
-
260
-
261
-
262
-
263
-
264
-
265
-
266
 |
 |

Table of Contents
PINNACLE WEST CAPITAL CORPORATION
NOTES TO CONSOLIDATED FINANCIAL STATEMENTS
Nuclear Fuel
APS amortizes nuclear fuel by using the unit-of-production method. The unit-of-production method is based on actual physical usage. APS divides
the cost of the fuel by the estimated number of thermal units it expects to produce with that fuel. APS then multiplies that rate by the number of thermal units
produced within the current period. This calculation determines the current period nuclear fuel expense.
APS also charges nuclear fuel expense for the interim storage and permanent disposal of spent nuclear fuel. The DOE is responsible for the
permanent disposal of spent nuclear fuel and charges APS $0.001 per kWh of nuclear generation. See Note 11 for information on spent nuclear fuel disposal
costs.
Income Taxes
Income taxes are provided using the asset and liability approach prescribed by guidance relating to accounting for income taxes. We file our federal
income tax return on a consolidated basis, and we file our state income tax returns on a consolidated or unitary basis. In accordance with our intercompany
tax sharing agreement, federal and state income taxes are allocated to each first-tier subsidiary as though each first-tier subsidiary filed a separate income tax
return. Any difference between that method and the consolidated (and unitary) income tax liability is attributed to the parent company. The income tax
accounts reflect the tax and interest associated with management’s estimate of the largest amount of tax benefit that is greater than 50% likely of being realized
upon settlement for all known and measurable tax exposures (see Note 4).
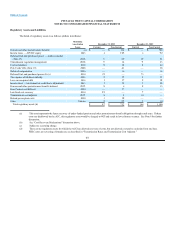
Cash and Cash Equivalents
We consider all highly liquid investments with a remaining maturity of three months or less at acquisition to be cash equivalents.
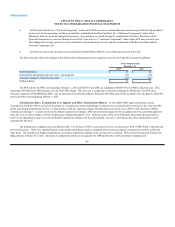
The following table summarizes supplemental Pinnacle West cash flow information for each of the last three years (dollars in thousands):
Years ended December 31,
2013 2012 2011
Cash paid during the period for:
Income taxes, net of refunds $18,537 $ 2,543 $ 10,324
Interest, net of amounts capitalized 184,010 200,923 217,789
Significant non-cash investing and financing activities:
Accrued capital expenditures $33,184 $26,208 $27,245
Dividends declared but not paid 62,528 59,789 —
Liabilities assumed relating to acquisition of SCE Four Corners’ interest (see Note 3) 145,609 — —
92