APS 2013 Annual Report Download - page 75
Download and view the complete annual report
Please find page 75 of the 2013 APS annual report below. You can navigate through the pages in the report by either clicking on the pages listed below, or by using the keyword search tool below to find specific information within the annual report.-
 1
1 -
2
-
3
-
4
-
5
-
6
-
7
-
8
-
9
-
10
-
11
-
12
-
13
-
14
-
15
-
16
-
17
-
18
-
19
-
20
-
21
-
22
-
23
-
24
-
25
-
26
-
27
-
28
-
29
-
30
-
31
-
32
-
33
-
34
-
35
-
36
-
37
-
38
-
39
-
40
-
41
-
42
-
43
-
44
-
45
-
46
-
47
-
48
-
49
-
50
-
51
-
52
-
53
-
54
-
55
-
56
-
57
-
58
-
59
-
60
-
61
-
62
-
63
-
64
-
 65
65 -
 66
66 -
 67
67 -
 68
68 -
 69
69 -
 70
70 -
 71
71 -
 72
72 -
 73
73 -
 74
74 -
 75
75 -
 76
76 -
 77
77 -
 78
78 -
 79
79 -
 80
80 -
 81
81 -
 82
82 -
 83
83 -
 84
84 -
 85
85 -
86
-
87
-
88
-
89
-
90
-
91
-
92
-
93
-
94
-
95
-
96
-
97
-
98
-
99
-
100
-
101
-
102
-
103
-
104
-
105
-
106
-
107
-
108
-
109
-
110
-
111
-
112
-
113
-
114
-
115
-
116
-
117
-
118
-
119
-
120
-
121
-
122
-
123
-
124
-
125
-
126
-
127
-
128
-
129
-
130
-
131
-
132
-
133
-
134
-
135
-
136
-
137
-
138
-
139
-
140
-
141
-
142
-
143
-
144
-
145
-
146
-
147
-
148
-
149
-
150
-
151
-
152
-
153
-
154
-
155
-
156
-
157
-
158
-
159
-
160
-
161
-
162
-
163
-
164
-
165
-
166
-
167
-
168
-
169
-
170
-
171
-
172
-
173
-
174
-
175
-
176
-
177
-
178
-
179
-
180
-
181
-
182
-
183
-
184
-
185
-
186
-
187
-
188
-
189
-
190
-
191
-
192
-
193
-
194
-
195
-
196
-
197
-
198
-
199
-
200
-
201
-
202
-
203
-
204
-
205
-
206
-
207
-
208
-
209
-
210
-
211
-
212
-
213
-
214
-
215
-
216
-
217
-
218
-
219
-
220
-
221
-
222
-
223
-
224
-
225
-
226
-
227
-
228
-
229
-
230
-
231
-
232
-
233
-
234
-
235
-
236
-
237
-
238
-
239
-
240
-
241
-
242
-
243
-
244
-
245
-
246
-
247
-
248
-
249
-
250
-
251
-
252
-
253
-
254
-
255
-
256
-
257
-
258
-
259
-
260
-
261
-
262
-
263
-
264
-
265
-
266
 |
 |

Table of Contents
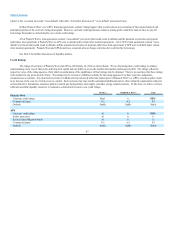
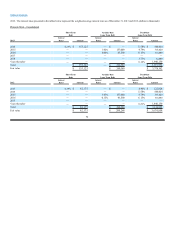
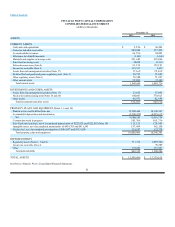
2012. The interest rates presented in the tables below represent the weighted-average interest rates as of December 31, 2013 and 2012 (dollars in thousands):
Pinnacle West – Consolidated
Short-Term
Debt
Variable-Rate
Long-Term Debt
Fixed-Rate
Long-Term Debt
Interest Interest Interest
2013 Rates Amount Rates Amount Rates Amount
2014 0.23% $153,125 — $ — 5.58% $540,424
2015 — — 1.02%157,000 4.79%313,420
2016 — — 0.06%43,580 6.15%314,000
2017 — — — — — —
2018 — — — — 1.75%32,000
Years thereafter ————6.12%1,940,150
Total $153,125 —$200,580 $3,139,994
Fair value $153,125 $200,580 $3,378,102
Short-Term
Debt
Variable-Rate
Long-Term Debt
Fixed-Rate
Long-Term Debt
Interest Interest Interest
2012 Rates Amount Rates Amount Rates Amount
2013 0.38% $92,175 — $ — 4.94% $122,828
2014 — — — — 5.58%540,424
2015 — — 1.07%157,000 4.79%313,420
2016 — — 0.15%43,580 6.15%314,000
2017 — — — — — —
Years thereafter ————6.21%1,840,150
Total $92,175 $200,580 $3,130,822
Fair value $92,175 $ 200,268 $ 3,674,958
72