APS 2013 Annual Report Download - page 163
Download and view the complete annual report
Please find page 163 of the 2013 APS annual report below. You can navigate through the pages in the report by either clicking on the pages listed below, or by using the keyword search tool below to find specific information within the annual report.-
 1
1 -
2
-
3
-
4
-
5
-
6
-
7
-
8
-
9
-
10
-
11
-
12
-
13
-
14
-
15
-
16
-
17
-
18
-
19
-
20
-
21
-
22
-
23
-
24
-
25
-
26
-
27
-
28
-
29
-
30
-
31
-
32
-
33
-
34
-
35
-
36
-
37
-
38
-
39
-
40
-
41
-
42
-
43
-
44
-
45
-
46
-
47
-
48
-
49
-
50
-
51
-
52
-
53
-
54
-
55
-
56
-
57
-
58
-
59
-
60
-
61
-
62
-
63
-
64
-
65
-
66
-
67
-
68
-
69
-
70
-
71
-
72
-
73
-
74
-
75
-
76
-
77
-
78
-
79
-
80
-
81
-
82
-
83
-
84
-
85
-
86
-
87
-
88
-
89
-
90
-
91
-
92
-
93
-
94
-
95
-
96
-
97
-
98
-
99
-
100
-
101
-
102
-
103
-
104
-
105
-
106
-
107
-
108
-
109
-
110
-
111
-
112
-
113
-
114
-
115
-
116
-
117
-
118
-
119
-
120
-
121
-
122
-
123
-
124
-
125
-
126
-
127
-
128
-
129
-
130
-
131
-
132
-
133
-
134
-
135
-
136
-
137
-
138
-
139
-
140
-
141
-
142
-
143
-
144
-
145
-
146
-
147
-
148
-
149
-
150
-
151
-
152
-
 153
153 -
 154
154 -
 155
155 -
 156
156 -
 157
157 -
 158
158 -
 159
159 -
 160
160 -
 161
161 -
 162
162 -
 163
163 -
 164
164 -
 165
165 -
 166
166 -
 167
167 -
 168
168 -
 169
169 -
 170
170 -
 171
171 -
 172
172 -
 173
173 -
174
-
175
-
176
-
177
-
178
-
179
-
180
-
181
-
182
-
183
-
184
-
185
-
186
-
187
-
188
-
189
-
190
-
191
-
192
-
193
-
194
-
195
-
196
-
197
-
198
-
199
-
200
-
201
-
202
-
203
-
204
-
205
-
206
-
207
-
208
-
209
-
210
-
211
-
212
-
213
-
214
-
215
-
216
-
217
-
218
-
219
-
220
-
221
-
222
-
223
-
224
-
225
-
226
-
227
-
228
-
229
-
230
-
231
-
232
-
233
-
234
-
235
-
236
-
237
-
238
-
239
-
240
-
241
-
242
-
243
-
244
-
245
-
246
-
247
-
248
-
249
-
250
-
251
-
252
-
253
-
254
-
255
-
256
-
257
-
258
-
259
-
260
-
261
-
262
-
263
-
264
-
265
-
266
 |
 |

Table of Contents
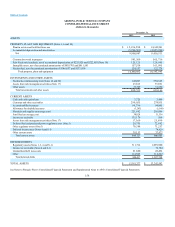
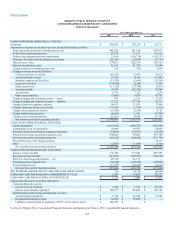
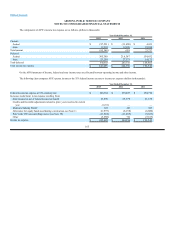
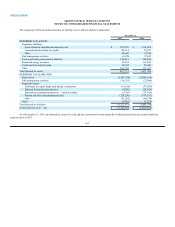
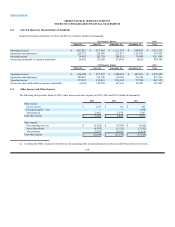
ARIZONA PUBLIC SERVICE COMPANY
CONSOLIDATED BALANCE SHEETS
(dollars in thousands)
December 31,
2013 2012
LIABILITIES AND EQUITY
CAPITALIZATION
Common stock $178,162 $178,162
Additional paid-in capital 2,379,696 2,379,696
Retained earnings 1,804,398 1,624,237
Accumulated other comprehensive (loss):
Pension and other postretirement benefits (Note 8) (30,313)(39,503)
Derivative instruments (Note 17) (23,059) (49,592)
Total shareholder equity 4,308,884 4,093,000
Noncontrolling interests (Note 19) 145,990 129,483
Total equity 4,454,874 4,222,483
Long-term debt less current maturities (Note 6) 2,671,465 3,074,088
Total capitalization 7,126,339 7,296,571
CURRENT LIABILITIES
Short-term borrowings (Note 5) 153,125 92,175
Current maturities of long-term debt (Note 6) 540,424 122,828
Accounts payable 281,237 215,577
Accrued taxes (Notes 4 and S-1) 122,460 116,700
Accrued interest 48,132 49,135
Common dividends payable 62,500 59,800
Customer deposits 76,101 79,689
Deferred income taxes 2,033 —
Liabilities from risk management activities (Note 17) 31,892 73,741
Liabilities for asset retirements (Note 12) 32,896 —
Regulatory liabilities (Note 3) 99,273 88,116
Other current liabilities 130,774 145,326
Total current liabilities 1,580,847 1,043,087
DEFERRED CREDITS AND OTHER
Deferred income taxes (Notes 4 and S-1) 2,347,724 2,133,976
Regulatory liabilities (Notes 1, 3, 4, and S-1) 801,297 759,201
Liability for asset retirements (Note 12) 313,833 357,097
Liabilities for pension and other postretirement benefits (Note 8) 476,017 1,017,556
Liabilities from risk management activities (Note 17) 70,315 85,264
Customer advances 114,480 109,359
Coal mine reclamation 207,453 118,860
Deferred investment tax credit 152,361 99,819
Unrecognized tax benefits (Notes 4 and S-1) 42,209 70,932
Other 148,502 150,820
Total deferred credits and other 4,674,191 4,902,884
COMMITMENTS AND CONTINGENCIES (SEE NOTES)
TOTAL LIABILITIES AND EQUITY $13,381,377 $ 13,242,542
See Notes to Pinnacle West’s Consolidated Financial Statements and Supplemental Notes to APS’s Consolidated Financial Statements.
159