APS 2013 Annual Report Download - page 65
Download and view the complete annual report
Please find page 65 of the 2013 APS annual report below. You can navigate through the pages in the report by either clicking on the pages listed below, or by using the keyword search tool below to find specific information within the annual report.-
 1
1 -
2
-
3
-
4
-
5
-
6
-
7
-
8
-
9
-
10
-
11
-
12
-
13
-
14
-
15
-
16
-
17
-
18
-
19
-
20
-
21
-
22
-
23
-
24
-
25
-
26
-
27
-
28
-
29
-
30
-
31
-
32
-
33
-
34
-
35
-
36
-
37
-
38
-
39
-
40
-
41
-
42
-
43
-
44
-
45
-
46
-
47
-
48
-
49
-
50
-
51
-
52
-
53
-
54
-
 55
55 -
 56
56 -
 57
57 -
 58
58 -
 59
59 -
 60
60 -
 61
61 -
 62
62 -
 63
63 -
 64
64 -
 65
65 -
 66
66 -
 67
67 -
 68
68 -
 69
69 -
 70
70 -
 71
71 -
 72
72 -
 73
73 -
 74
74 -
 75
75 -
76
-
77
-
78
-
79
-
80
-
81
-
82
-
83
-
84
-
85
-
86
-
87
-
88
-
89
-
90
-
91
-
92
-
93
-
94
-
95
-
96
-
97
-
98
-
99
-
100
-
101
-
102
-
103
-
104
-
105
-
106
-
107
-
108
-
109
-
110
-
111
-
112
-
113
-
114
-
115
-
116
-
117
-
118
-
119
-
120
-
121
-
122
-
123
-
124
-
125
-
126
-
127
-
128
-
129
-
130
-
131
-
132
-
133
-
134
-
135
-
136
-
137
-
138
-
139
-
140
-
141
-
142
-
143
-
144
-
145
-
146
-
147
-
148
-
149
-
150
-
151
-
152
-
153
-
154
-
155
-
156
-
157
-
158
-
159
-
160
-
161
-
162
-
163
-
164
-
165
-
166
-
167
-
168
-
169
-
170
-
171
-
172
-
173
-
174
-
175
-
176
-
177
-
178
-
179
-
180
-
181
-
182
-
183
-
184
-
185
-
186
-
187
-
188
-
189
-
190
-
191
-
192
-
193
-
194
-
195
-
196
-
197
-
198
-
199
-
200
-
201
-
202
-
203
-
204
-
205
-
206
-
207
-
208
-
209
-
210
-
211
-
212
-
213
-
214
-
215
-
216
-
217
-
218
-
219
-
220
-
221
-
222
-
223
-
224
-
225
-
226
-
227
-
228
-
229
-
230
-
231
-
232
-
233
-
234
-
235
-
236
-
237
-
238
-
239
-
240
-
241
-
242
-
243
-
244
-
245
-
246
-
247
-
248
-
249
-
250
-
251
-
252
-
253
-
254
-
255
-
256
-
257
-
258
-
259
-
260
-
261
-
262
-
263
-
264
-
265
-
266
 |
 |

Table of Contents
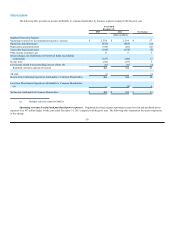
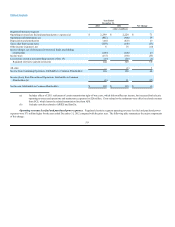
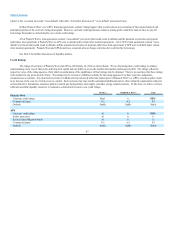
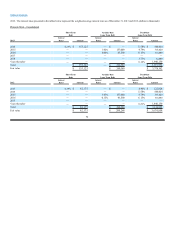
Summary of Cash Flows
The following tables present net cash provided by (used for) operating, investing and financing activities for the years ended December 31, 2013,
2012 and 2011 (dollars in millions):
Pinnacle West Consolidated
2013 2012 2011
Net cash flow provided by operating activities $1,153 $1,171 $1,125
Net cash flow used for investing activities (1,009)(873)(782)
Net cash flow used for financing activities (161) (305)(420)
Net decrease in cash and cash equivalents $(17)$(7)$(77)
Arizona Public Service Company
2013 2012 2011
Net cash flow provided by operating activities $1,194 $1,176 $1,128
Net cash flow used for investing activities (1,009)(873)(834)
Net cash flow used for financing activities (185) (319)(374)
Net decrease in cash and cash equivalents $ — $ (16)$(80)
Operating Cash Flows
2013 Compared with 2012. Pinnacle West’s consolidated net cash provided by operating activities was $1,153 million in 2013, compared to
$1,171 million in 2012, a decrease of $18 million in net cash provided. The decrease is primarily related to a $127 million change in cash collateral posted
and $76 million of higher pension contributions made in 2013 compared to 2012 (approximately $18 million of which is reflected in capital expenditures).
The decrease is partially offset by approximately $167 million of higher cash inflows primarily due to higher authorized revenue requirements resulting from
the retail regulatory settlement effective July 1, 2012 and other changes in working capital.
2012 Compared with 2011. Pinnacle West’s consolidated net cash provided by operating activities was $1,171 million in 2012, compared to
$1,125 million in 2011, an increase of $46 million in net cash provided. The increase is primarily related to a $77 million reduction of cash collateral posted
and a decrease of $23 million in cash paid for interest in the current year, partially offset by a $26 million increase in property tax payments, a $65 million
pension contribution in 2012 (approximately $12 million of which is reflected in capital expenditures) and other changes in working capital.
Other. Pinnacle West sponsors a qualified defined benefit pension plan and a non-qualified supplemental excess benefit retirement plan for the
employees of Pinnacle West and our subsidiaries. The requirements of the Employee Retirement Income Security Act of 1974 (“ERISA”) require us to
contribute a minimum amount to the qualified plan. We contribute at least the minimum amount required under ERISA regulations, but no more than the
maximum tax-deductible amount. The minimum required funding takes into consideration the value of plan assets and our pension benefit obligations.
Under ERISA, the qualified pension plan was 107% funded as of January 1, 2013 and is estimated to be approximately 103% funded as of January 1, 2014.
The assets in the plan are comprised of fixed-income, equity, real estate, and short-term investments. Future year contribution amounts are dependent on plan
asset performance and plan actuarial assumptions. We made contributions to our pension plan totaling $141 million in 2013, $65 million in 2012, and zero
in 2011. The minimum contributions for the pension plan total $141 million for the next three years under the recently enacted Moving Ahead
62