APS 2013 Annual Report Download - page 66
Download and view the complete annual report
Please find page 66 of the 2013 APS annual report below. You can navigate through the pages in the report by either clicking on the pages listed below, or by using the keyword search tool below to find specific information within the annual report.-
 1
1 -
2
-
3
-
4
-
5
-
6
-
7
-
8
-
9
-
10
-
11
-
12
-
13
-
14
-
15
-
16
-
17
-
18
-
19
-
20
-
21
-
22
-
23
-
24
-
25
-
26
-
27
-
28
-
29
-
30
-
31
-
32
-
33
-
34
-
35
-
36
-
37
-
38
-
39
-
40
-
41
-
42
-
43
-
44
-
45
-
46
-
47
-
48
-
49
-
50
-
51
-
52
-
53
-
54
-
55
-
 56
56 -
 57
57 -
 58
58 -
 59
59 -
 60
60 -
 61
61 -
 62
62 -
 63
63 -
 64
64 -
 65
65 -
 66
66 -
 67
67 -
 68
68 -
 69
69 -
 70
70 -
 71
71 -
 72
72 -
 73
73 -
 74
74 -
 75
75 -
 76
76 -
77
-
78
-
79
-
80
-
81
-
82
-
83
-
84
-
85
-
86
-
87
-
88
-
89
-
90
-
91
-
92
-
93
-
94
-
95
-
96
-
97
-
98
-
99
-
100
-
101
-
102
-
103
-
104
-
105
-
106
-
107
-
108
-
109
-
110
-
111
-
112
-
113
-
114
-
115
-
116
-
117
-
118
-
119
-
120
-
121
-
122
-
123
-
124
-
125
-
126
-
127
-
128
-
129
-
130
-
131
-
132
-
133
-
134
-
135
-
136
-
137
-
138
-
139
-
140
-
141
-
142
-
143
-
144
-
145
-
146
-
147
-
148
-
149
-
150
-
151
-
152
-
153
-
154
-
155
-
156
-
157
-
158
-
159
-
160
-
161
-
162
-
163
-
164
-
165
-
166
-
167
-
168
-
169
-
170
-
171
-
172
-
173
-
174
-
175
-
176
-
177
-
178
-
179
-
180
-
181
-
182
-
183
-
184
-
185
-
186
-
187
-
188
-
189
-
190
-
191
-
192
-
193
-
194
-
195
-
196
-
197
-
198
-
199
-
200
-
201
-
202
-
203
-
204
-
205
-
206
-
207
-
208
-
209
-
210
-
211
-
212
-
213
-
214
-
215
-
216
-
217
-
218
-
219
-
220
-
221
-
222
-
223
-
224
-
225
-
226
-
227
-
228
-
229
-
230
-
231
-
232
-
233
-
234
-
235
-
236
-
237
-
238
-
239
-
240
-
241
-
242
-
243
-
244
-
245
-
246
-
247
-
248
-
249
-
250
-
251
-
252
-
253
-
254
-
255
-
256
-
257
-
258
-
259
-
260
-
261
-
262
-
263
-
264
-
265
-
266
 |
 |

Table of Contents
for Progress in the 21 Century Act (zero in 2014, $19 million in 2015 and $122 million in 2016). Instead, we expect to make voluntary contributions
totaling $300 million for the next three years ($175 million in 2014, of which $70 million was already contributed in early 2014, up to $100 million in 2015,
and up to $25 million in 2016). With regard to contributions to our other postretirement benefit plans, we made a contribution of approximately $14 million
in 2013, $23 million in 2012, and $19 million in 2011. The contributions to our other postretirement benefit plans for 2014, 2015 and 2016 are expected to
be approximately $10 million each year.
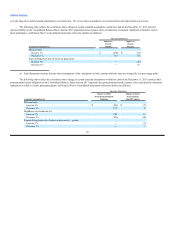
The $70 million long-term income tax receivable on the Consolidated Balance Sheets as of December 31, 2012 represented the anticipated refund
related to an APS tax accounting method change approved by the Internal Revenue Service (“IRS”) in the third quarter of 2009. On July 9, 2013, IRS
guidance was released which provided clarification regarding the timing and amount of this cash receipt. As a result of this guidance, uncertain tax positions
decreased $67 million during the third quarter. This decrease in uncertain tax positions resulted in a corresponding increase to the total anticipated refund due
from the IRS and an offsetting increase in long-term deferred tax liabilities. Additionally, as a result of this IRS guidance, the resulting $137 million
anticipated refund was reclassified to current income tax receivable.
During the year ended December 31, 2013, the IRS finalized the examination of tax returns for the years ended December 31, 2008 and 2009, and the
$137 million anticipated refund was reduced by approximately $4 million to reflect the outcome of this examination. On December 17, 2013, the Joint
Committee on Taxation approved the anticipated refund. Cash related to this refund was received in the first quarter of 2014.
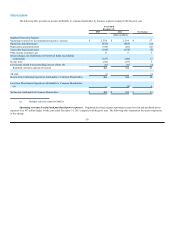
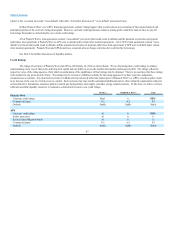
Investing Cash Flows
2013 Compared with 2012. Pinnacle West’s consolidated net cash used for investing activities was $1,009 million in 2013, compared to $873
million in 2012, an increase of $136 million in net cash used. The increase in net cash used for investing activities is primarily related to APS’s purchase of
SCE’s interest in Units 4 and 5 of Four Corners of approximately $209 million, partially offset by a decrease of approximately $73 million in other capital
expenditures.
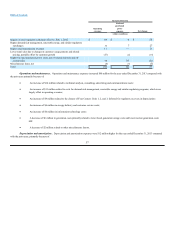
2012 Compared with 2011. Pinnacle West’s consolidated net cash used for investing activities was $873 million in 2012, compared to $782
million in 2011, an increase of $91 million in net cash used. The increase in net cash used for investing activities is primarily due to the absence of $55
million in proceeds from the sale of life insurance policies in 2011 and the absence of $45 million in proceeds from the sale of Pinnacle West’s investment in
APSES in 2011.
63
st