APS 2013 Annual Report Download - page 58
Download and view the complete annual report
Please find page 58 of the 2013 APS annual report below. You can navigate through the pages in the report by either clicking on the pages listed below, or by using the keyword search tool below to find specific information within the annual report.-
 1
1 -
2
-
3
-
4
-
5
-
6
-
7
-
8
-
9
-
10
-
11
-
12
-
13
-
14
-
15
-
16
-
17
-
18
-
19
-
20
-
21
-
22
-
23
-
24
-
25
-
26
-
27
-
28
-
29
-
30
-
31
-
32
-
33
-
34
-
35
-
36
-
37
-
38
-
39
-
40
-
41
-
42
-
43
-
44
-
45
-
46
-
47
-
 48
48 -
 49
49 -
 50
50 -
 51
51 -
 52
52 -
 53
53 -
 54
54 -
 55
55 -
 56
56 -
 57
57 -
 58
58 -
 59
59 -
 60
60 -
 61
61 -
 62
62 -
 63
63 -
 64
64 -
 65
65 -
 66
66 -
 67
67 -
 68
68 -
69
-
70
-
71
-
72
-
73
-
74
-
75
-
76
-
77
-
78
-
79
-
80
-
81
-
82
-
83
-
84
-
85
-
86
-
87
-
88
-
89
-
90
-
91
-
92
-
93
-
94
-
95
-
96
-
97
-
98
-
99
-
100
-
101
-
102
-
103
-
104
-
105
-
106
-
107
-
108
-
109
-
110
-
111
-
112
-
113
-
114
-
115
-
116
-
117
-
118
-
119
-
120
-
121
-
122
-
123
-
124
-
125
-
126
-
127
-
128
-
129
-
130
-
131
-
132
-
133
-
134
-
135
-
136
-
137
-
138
-
139
-
140
-
141
-
142
-
143
-
144
-
145
-
146
-
147
-
148
-
149
-
150
-
151
-
152
-
153
-
154
-
155
-
156
-
157
-
158
-
159
-
160
-
161
-
162
-
163
-
164
-
165
-
166
-
167
-
168
-
169
-
170
-
171
-
172
-
173
-
174
-
175
-
176
-
177
-
178
-
179
-
180
-
181
-
182
-
183
-
184
-
185
-
186
-
187
-
188
-
189
-
190
-
191
-
192
-
193
-
194
-
195
-
196
-
197
-
198
-
199
-
200
-
201
-
202
-
203
-
204
-
205
-
206
-
207
-
208
-
209
-
210
-
211
-
212
-
213
-
214
-
215
-
216
-
217
-
218
-
219
-
220
-
221
-
222
-
223
-
224
-
225
-
226
-
227
-
228
-
229
-
230
-
231
-
232
-
233
-
234
-
235
-
236
-
237
-
238
-
239
-
240
-
241
-
242
-
243
-
244
-
245
-
246
-
247
-
248
-
249
-
250
-
251
-
252
-
253
-
254
-
255
-
256
-
257
-
258
-
259
-
260
-
261
-
262
-
263
-
264
-
265
-
266
 |
 |

Table of Contents
distribution facilities), and changes in depreciation and amortization rates. See “Capital Expenditures” below for information regarding the planned additions
to our facilities. See Note 1 regarding deferral of certain costs pursuant to an ACC order.
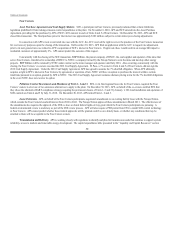
Property Taxes. Taxes other than income taxes consist primarily of property taxes, which are affected by the value of property in-service and under
construction, assessment ratios, and tax rates. The average property tax rate in Arizona for APS, which owns essentially all of our property, was 10.5% of the
assessed value for 2013, 9.6% for 2012, and 9.0% for 2011. We expect property taxes to increase as we add new generating units and continue with
improvements and expansions to our existing generating units, transmission and distribution facilities. (See Note 3 for property tax deferrals contained in the
2012 Settlement Agreement).
Income Taxes. Income taxes are affected by the amount of pretax book income, income tax rates, certain deductions and non-taxable items, such as
AFUDC. In addition, income taxes may also be affected by the settlement of issues with taxing authorities.
Interest Expense. Interest expense is affected by the amount of debt outstanding and the interest rates on that debt (see Note 6). The primary
factors affecting borrowing levels are expected to be our capital expenditures, long-term debt maturities, equity issuances and internally generated cash flow.
An allowance for borrowed funds used during construction offsets a portion of interest expense while capital projects are under construction. We stop accruing
AFUDC on a project when it is placed in commercial operation.
RESULTS OF OPERATIONS
Pinnacle West’s only reportable business segment is our regulated electricity segment, which consists of traditional regulated retail and wholesale
electricity businesses (primarily electric service to Native Load customers) and related activities and includes electricity generation, transmission and
distribution.
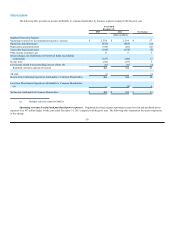
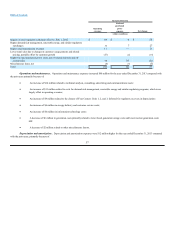
Operating Results – 2013 compared with 2012.
Our consolidated net income attributable to common shareholders for the year ended December 31, 2013 was $406 million, compared with net
income of $382 million for the prior year. The results reflect an increase of approximately $21 million for the regulated electricity segment, primarily due to
increases related to the retail regulatory settlement effective July 1, 2012 (see Note 3); higher retail transmission revenues; and lower net interest charges due to
lower debt balances and lower interest rates in the current-year period. These positive factors were partially offset by higher operations and maintenance
expenses; higher fuel and purchased power costs, net of related deferrals; lower retail sales as a result of changes in customer usage related to energy efficiency,
customer conservation and distributed generation, partially offset by customer growth; and higher depreciation and amortization expenses.
55