APS 2013 Annual Report Download - page 125
Download and view the complete annual report
Please find page 125 of the 2013 APS annual report below. You can navigate through the pages in the report by either clicking on the pages listed below, or by using the keyword search tool below to find specific information within the annual report.-
 1
1 -
2
-
3
-
4
-
5
-
6
-
7
-
8
-
9
-
10
-
11
-
12
-
13
-
14
-
15
-
16
-
17
-
18
-
19
-
20
-
21
-
22
-
23
-
24
-
25
-
26
-
27
-
28
-
29
-
30
-
31
-
32
-
33
-
34
-
35
-
36
-
37
-
38
-
39
-
40
-
41
-
42
-
43
-
44
-
45
-
46
-
47
-
48
-
49
-
50
-
51
-
52
-
53
-
54
-
55
-
56
-
57
-
58
-
59
-
60
-
61
-
62
-
63
-
64
-
65
-
66
-
67
-
68
-
69
-
70
-
71
-
72
-
73
-
74
-
75
-
76
-
77
-
78
-
79
-
80
-
81
-
82
-
83
-
84
-
85
-
86
-
87
-
88
-
89
-
90
-
91
-
92
-
93
-
94
-
95
-
96
-
97
-
98
-
99
-
100
-
101
-
102
-
103
-
104
-
105
-
106
-
107
-
108
-
109
-
110
-
111
-
112
-
113
-
114
-
 115
115 -
 116
116 -
 117
117 -
 118
118 -
 119
119 -
 120
120 -
 121
121 -
 122
122 -
 123
123 -
 124
124 -
 125
125 -
 126
126 -
 127
127 -
 128
128 -
 129
129 -
 130
130 -
 131
131 -
 132
132 -
 133
133 -
 134
134 -
 135
135 -
136
-
137
-
138
-
139
-
140
-
141
-
142
-
143
-
144
-
145
-
146
-
147
-
148
-
149
-
150
-
151
-
152
-
153
-
154
-
155
-
156
-
157
-
158
-
159
-
160
-
161
-
162
-
163
-
164
-
165
-
166
-
167
-
168
-
169
-
170
-
171
-
172
-
173
-
174
-
175
-
176
-
177
-
178
-
179
-
180
-
181
-
182
-
183
-
184
-
185
-
186
-
187
-
188
-
189
-
190
-
191
-
192
-
193
-
194
-
195
-
196
-
197
-
198
-
199
-
200
-
201
-
202
-
203
-
204
-
205
-
206
-
207
-
208
-
209
-
210
-
211
-
212
-
213
-
214
-
215
-
216
-
217
-
218
-
219
-
220
-
221
-
222
-
223
-
224
-
225
-
226
-
227
-
228
-
229
-
230
-
231
-
232
-
233
-
234
-
235
-
236
-
237
-
238
-
239
-
240
-
241
-
242
-
243
-
244
-
245
-
246
-
247
-
248
-
249
-
250
-
251
-
252
-
253
-
254
-
255
-
256
-
257
-
258
-
259
-
260
-
261
-
262
-
263
-
264
-
265
-
266
 |
 |

Table of Contents
PINNACLE WEST CAPITAL CORPORATION
NOTES TO CONSOLIDATED FINANCIAL STATEMENTS
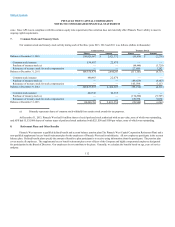
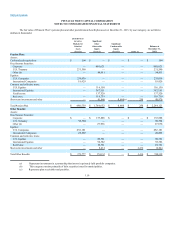
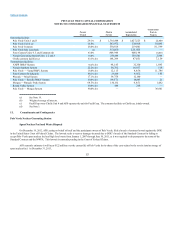
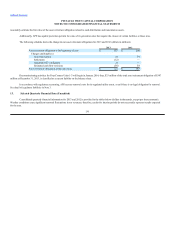
The following table shows the changes in fair value for assets that are measured at fair value on a recurring basis using significant unobservable
inputs (Level 3) for the year ended December 31, 2013 and 2012 (dollars in thousands):
Pension
Short-Term Investments and Other 2013 2012
Beginning balance at January 1 $2,419 $ —
Actual return on assets still held at December 31 (498)(668)
Purchases, sales, and settlements 6,739 3,087
Transfers in and/or out of Level 3 — —
Ending balance at December 31 $8,660 $2,419
Contributions
Future year contribution amounts are dependent on plan asset performance and plan actuarial assumptions. We made contributions to our pension
plan totaling $141 million in 2013, $65 million in 2012, and zero in 2011. The minimum contributions for the pension plan total $141 million for the next
three years under the recently enacted Moving Ahead for Progress in the 21 Century Act (zero in 2014, $19 million in 2015, and $122 million in 2016).
Instead, we expect to make voluntary contributions totaling $300 million for the next three years ($175 million in 2014, of which $70 million was already
contributed in early 2014, up to $100 million in 2015, and up to $25 million in 2016). With regard to contributions to our other postretirement benefit plans,
we made a contribution of approximately $14 million in 2013, $23 million in 2012, and $19 million in 2011. The contributions to our other postretirement
benefit plans for 2014, 2015 and 2016 are expected to be approximately $10 million each year. APS funds its share of the contributions. APS’s share of the
pension plan contribution was $140 million in 2013, $64 million in 2012, and zero in 2011. APS’s share of the contributions to the other postretirement
benefit plan was $14 million in 2013, $22 million in 2012, and $19 million in 2011.
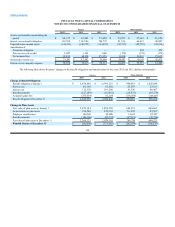
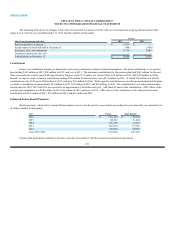
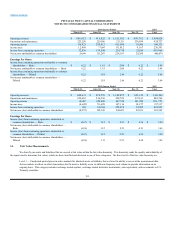
Estimated Future Benefit Payments
Benefit payments, which reflect estimated future employee service, for the next five years and the succeeding five years thereafter, are estimated to be
as follows (dollars in thousands):
Year Pension Other Benefits
2014 $129,159 $28,664
2015 143,452 31,804
2016 149,105 34,933
2017 162,678 37,966
2018 169,064 40,972
Years 2019-2023 972,826 245,366
Electric plant participants contribute to the above amounts in accordance with their respective participation agreements.
121
st