APS 2013 Annual Report Download - page 57
Download and view the complete annual report
Please find page 57 of the 2013 APS annual report below. You can navigate through the pages in the report by either clicking on the pages listed below, or by using the keyword search tool below to find specific information within the annual report.-
 1
1 -
2
-
3
-
4
-
5
-
6
-
7
-
8
-
9
-
10
-
11
-
12
-
13
-
14
-
15
-
16
-
17
-
18
-
19
-
20
-
21
-
22
-
23
-
24
-
25
-
26
-
27
-
28
-
29
-
30
-
31
-
32
-
33
-
34
-
35
-
36
-
37
-
38
-
39
-
40
-
41
-
42
-
43
-
44
-
45
-
46
-
 47
47 -
 48
48 -
 49
49 -
 50
50 -
 51
51 -
 52
52 -
 53
53 -
 54
54 -
 55
55 -
 56
56 -
 57
57 -
 58
58 -
 59
59 -
 60
60 -
 61
61 -
 62
62 -
 63
63 -
 64
64 -
 65
65 -
 66
66 -
 67
67 -
68
-
69
-
70
-
71
-
72
-
73
-
74
-
75
-
76
-
77
-
78
-
79
-
80
-
81
-
82
-
83
-
84
-
85
-
86
-
87
-
88
-
89
-
90
-
91
-
92
-
93
-
94
-
95
-
96
-
97
-
98
-
99
-
100
-
101
-
102
-
103
-
104
-
105
-
106
-
107
-
108
-
109
-
110
-
111
-
112
-
113
-
114
-
115
-
116
-
117
-
118
-
119
-
120
-
121
-
122
-
123
-
124
-
125
-
126
-
127
-
128
-
129
-
130
-
131
-
132
-
133
-
134
-
135
-
136
-
137
-
138
-
139
-
140
-
141
-
142
-
143
-
144
-
145
-
146
-
147
-
148
-
149
-
150
-
151
-
152
-
153
-
154
-
155
-
156
-
157
-
158
-
159
-
160
-
161
-
162
-
163
-
164
-
165
-
166
-
167
-
168
-
169
-
170
-
171
-
172
-
173
-
174
-
175
-
176
-
177
-
178
-
179
-
180
-
181
-
182
-
183
-
184
-
185
-
186
-
187
-
188
-
189
-
190
-
191
-
192
-
193
-
194
-
195
-
196
-
197
-
198
-
199
-
200
-
201
-
202
-
203
-
204
-
205
-
206
-
207
-
208
-
209
-
210
-
211
-
212
-
213
-
214
-
215
-
216
-
217
-
218
-
219
-
220
-
221
-
222
-
223
-
224
-
225
-
226
-
227
-
228
-
229
-
230
-
231
-
232
-
233
-
234
-
235
-
236
-
237
-
238
-
239
-
240
-
241
-
242
-
243
-
244
-
245
-
246
-
247
-
248
-
249
-
250
-
251
-
252
-
253
-
254
-
255
-
256
-
257
-
258
-
259
-
260
-
261
-
262
-
263
-
264
-
265
-
266
 |
 |

Table of Contents
mechanisms. These revenue transactions are affected by the availability of excess generation or other energy resources and wholesale market conditions,
including competition, demand and prices.
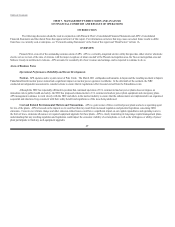
Customer and Sales Growth. Retail customer growth in APS’s service territory in 2013 was 1.3% compared with the prior year. For the three
years 2011 through 2013, APS’s customer growth averaged 1.0% per year. We currently expect annual customer growth to average about 2.5% for 2014
through 2016 based on our assessment of modestly improving economic conditions, both nationally and in Arizona. Retail electricity sales in kWh, adjusted
to exclude the effects of weather variations, decreased 0.5% in 2013 compared with the prior year, reflecting the effects of customer conservation and energy
efficiency and distributed renewable generation initiatives, offset by mildly improving economic conditions and customer growth. For the three years 2011
through 2013, APS experienced annual increases in retail electricity sales averaging 0.1%, adjusted to exclude the effects of weather variations. We currently
estimate that annual retail electricity sales in kWh will increase on average about 1% during 2014 through 2016, including the effects of customer conservation
and energy efficiency and distributed renewable generation initiatives, but excluding the effects of weather variations. A failure of the Arizona economy to
improve could further impact these estimates.
Actual sales growth, excluding weather-related variations, may differ from our projections as a result of numerous factors, such as economic
conditions, customer growth, usage patterns and energy conservation, impacts of energy efficiency programs and growth in distributed generation, and
responses to retail price changes. Based on past experience, a reasonable range of variation in our kWh sales projection attributable to such economic factors
under normal business conditions can result in increases or decreases in annual net income of up to $10 million.
Weather. In forecasting the retail sales growth numbers provided above, we assume normal weather patterns based on historical data. Historically,
extreme weather variations have resulted in annual variations in net income in excess of $20 million. However, our experience indicates that the more typical
variations from normal weather can result in increases or decreases in annual net income of up to $10 million.
Fuel and Purchased Power Costs. Fuel and purchased power costs included on our Consolidated Statements of Income are impacted by our
electricity sales volumes, existing contracts for purchased power and generation fuel, our power plant performance, transmission availability or constraints,
prevailing market prices, new generating plants being placed in service in our market areas, changes in our generation resource allocation, our hedging
program for managing such costs and PSA deferrals and the related amortization.
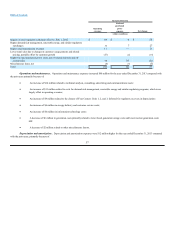
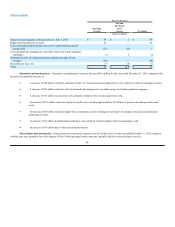
Operations and Maintenance Expenses . Operations and maintenance expenses are impacted by customer and sales growth, power plant
operations, maintenance of utility plant (including generation, transmission, and distribution facilities), inflation, outages, renewable energy and demand side
management related expenses (which are offset by the same amount of operating revenues) and other factors. In the 2009 Settlement Agreement, APS
committed to operational expense reductions from 2010 through 2014, and received approval to defer certain pension and other postretirement benefit cost
increases incurred in 2011 and 2012, which totaled $25 million, as a regulatory asset, until the most recent general retail rate case decision became effective on
July 1, 2012. In July 2012, we began amortizing the regulatory asset over a 36-month period.
Depreciation and Amortization Expenses. Depreciation and amortization expenses are impacted by net additions to utility plant and other
property (such as new generation, transmission, and
54