APS 2013 Annual Report Download - page 63
Download and view the complete annual report
Please find page 63 of the 2013 APS annual report below. You can navigate through the pages in the report by either clicking on the pages listed below, or by using the keyword search tool below to find specific information within the annual report.-
 1
1 -
2
-
3
-
4
-
5
-
6
-
7
-
8
-
9
-
10
-
11
-
12
-
13
-
14
-
15
-
16
-
17
-
18
-
19
-
20
-
21
-
22
-
23
-
24
-
25
-
26
-
27
-
28
-
29
-
30
-
31
-
32
-
33
-
34
-
35
-
36
-
37
-
38
-
39
-
40
-
41
-
42
-
43
-
44
-
45
-
46
-
47
-
48
-
49
-
50
-
51
-
52
-
 53
53 -
 54
54 -
 55
55 -
 56
56 -
 57
57 -
 58
58 -
 59
59 -
 60
60 -
 61
61 -
 62
62 -
 63
63 -
 64
64 -
 65
65 -
 66
66 -
 67
67 -
 68
68 -
 69
69 -
 70
70 -
 71
71 -
 72
72 -
 73
73 -
74
-
75
-
76
-
77
-
78
-
79
-
80
-
81
-
82
-
83
-
84
-
85
-
86
-
87
-
88
-
89
-
90
-
91
-
92
-
93
-
94
-
95
-
96
-
97
-
98
-
99
-
100
-
101
-
102
-
103
-
104
-
105
-
106
-
107
-
108
-
109
-
110
-
111
-
112
-
113
-
114
-
115
-
116
-
117
-
118
-
119
-
120
-
121
-
122
-
123
-
124
-
125
-
126
-
127
-
128
-
129
-
130
-
131
-
132
-
133
-
134
-
135
-
136
-
137
-
138
-
139
-
140
-
141
-
142
-
143
-
144
-
145
-
146
-
147
-
148
-
149
-
150
-
151
-
152
-
153
-
154
-
155
-
156
-
157
-
158
-
159
-
160
-
161
-
162
-
163
-
164
-
165
-
166
-
167
-
168
-
169
-
170
-
171
-
172
-
173
-
174
-
175
-
176
-
177
-
178
-
179
-
180
-
181
-
182
-
183
-
184
-
185
-
186
-
187
-
188
-
189
-
190
-
191
-
192
-
193
-
194
-
195
-
196
-
197
-
198
-
199
-
200
-
201
-
202
-
203
-
204
-
205
-
206
-
207
-
208
-
209
-
210
-
211
-
212
-
213
-
214
-
215
-
216
-
217
-
218
-
219
-
220
-
221
-
222
-
223
-
224
-
225
-
226
-
227
-
228
-
229
-
230
-
231
-
232
-
233
-
234
-
235
-
236
-
237
-
238
-
239
-
240
-
241
-
242
-
243
-
244
-
245
-
246
-
247
-
248
-
249
-
250
-
251
-
252
-
253
-
254
-
255
-
256
-
257
-
258
-
259
-
260
-
261
-
262
-
263
-
264
-
265
-
266
 |
 |

Table of Contents
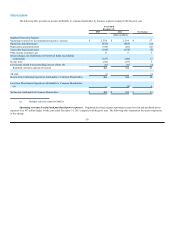
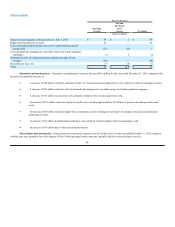
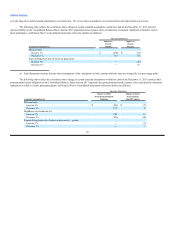
Increase (Decrease)
Operating
revenues
Fuel and
purchased
power
expenses Net change
(dollars in millions)
Impacts of retail regulatory settlement effective July 1, 2012 $ 64 $ 1 $ 63
Higher retail transmission revenues 41 —41
Lower fuel and purchased power costs, net of related deferrals and off-
system sales (11)(14)3
Lower demand-side management, renewable energy and similar regulatory
surcharges (3)4(7)
Settlement in 2011 of certain prior-period transmission right-of-way
revenues (28) — (28)
Miscellaneous items, net (7) (6) (1)
Total $56 $ (15)$ 71
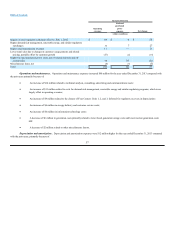
Operations and maintenance. Operations and maintenance expenses decreased $19 million for the year ended December 31, 2012 compared with
the prior year primarily because of:
· A decrease of $28 million related to settlement in 2011 of certain transmission right-of-way costs, which was offset in operating revenues;
· A decrease of $22 million related to costs for demand-side management, renewable energy and similar regulatory programs;
· A decrease of $15 million in generation costs, primarily related to lower nuclear generation costs;
· An increase of $21 million related to employee benefit costs, including approximately $12 million of pension and other postretirement
costs;
· An increase of $9 million related to higher stock compensation costs resulting from an improved company stock price and estimated
performance results;
· An increase of $7 million in information technology costs, primarily related to higher software maintenance; and
· An increase of $9 million due to other miscellaneous factors.
Depreciation and amortization. Depreciation and amortization expenses were $23 million lower for the year ended December 31, 2012 compared
with the prior year, primarily due to the impacts of Palo Verde operating license extensions, partially offset by increased plant in service.
60