APS 2013 Annual Report Download - page 15
Download and view the complete annual report
Please find page 15 of the 2013 APS annual report below. You can navigate through the pages in the report by either clicking on the pages listed below, or by using the keyword search tool below to find specific information within the annual report.-
 1
1 -
2
-
3
-
4
-
 5
5 -
 6
6 -
 7
7 -
 8
8 -
 9
9 -
 10
10 -
 11
11 -
 12
12 -
 13
13 -
 14
14 -
 15
15 -
 16
16 -
 17
17 -
 18
18 -
 19
19 -
 20
20 -
 21
21 -
 22
22 -
 23
23 -
 24
24 -
 25
25 -
26
-
27
-
28
-
29
-
30
-
31
-
32
-
33
-
34
-
35
-
36
-
37
-
38
-
39
-
40
-
41
-
42
-
43
-
44
-
45
-
46
-
47
-
48
-
49
-
50
-
51
-
52
-
53
-
54
-
55
-
56
-
57
-
58
-
59
-
60
-
61
-
62
-
63
-
64
-
65
-
66
-
67
-
68
-
69
-
70
-
71
-
72
-
73
-
74
-
75
-
76
-
77
-
78
-
79
-
80
-
81
-
82
-
83
-
84
-
85
-
86
-
87
-
88
-
89
-
90
-
91
-
92
-
93
-
94
-
95
-
96
-
97
-
98
-
99
-
100
-
101
-
102
-
103
-
104
-
105
-
106
-
107
-
108
-
109
-
110
-
111
-
112
-
113
-
114
-
115
-
116
-
117
-
118
-
119
-
120
-
121
-
122
-
123
-
124
-
125
-
126
-
127
-
128
-
129
-
130
-
131
-
132
-
133
-
134
-
135
-
136
-
137
-
138
-
139
-
140
-
141
-
142
-
143
-
144
-
145
-
146
-
147
-
148
-
149
-
150
-
151
-
152
-
153
-
154
-
155
-
156
-
157
-
158
-
159
-
160
-
161
-
162
-
163
-
164
-
165
-
166
-
167
-
168
-
169
-
170
-
171
-
172
-
173
-
174
-
175
-
176
-
177
-
178
-
179
-
180
-
181
-
182
-
183
-
184
-
185
-
186
-
187
-
188
-
189
-
190
-
191
-
192
-
193
-
194
-
195
-
196
-
197
-
198
-
199
-
200
-
201
-
202
-
203
-
204
-
205
-
206
-
207
-
208
-
209
-
210
-
211
-
212
-
213
-
214
-
215
-
216
-
217
-
218
-
219
-
220
-
221
-
222
-
223
-
224
-
225
-
226
-
227
-
228
-
229
-
230
-
231
-
232
-
233
-
234
-
235
-
236
-
237
-
238
-
239
-
240
-
241
-
242
-
243
-
244
-
245
-
246
-
247
-
248
-
249
-
250
-
251
-
252
-
253
-
254
-
255
-
256
-
257
-
258
-
259
-
260
-
261
-
262
-
263
-
264
-
265
-
266
 |
 |

Table of Contents
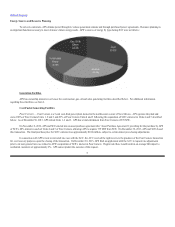
Current and Future Resources
Current Demand and Reserve Margin
Electric power demand is generally seasonal. In Arizona, demand for power peaks during the hot summer months. APS’s 2013 peak one-hour
demand on its electric system was recorded on July 8, 2013 at 6,927 MW, compared to the 2012 peak of 7,207 MW recorded on August 8, 2012. APS’s
reserve margin at the time of the 2013 peak demand, calculated using system load serving capacity, was 27%. Excluding certain contractual rights to call on
additional capacity on short notice, which APS may use in the event of unusual weather or unplanned outages, the 2013 reserve margin was 17%. APS
anticipates the reserve margin for 2014 will be approximately 34% or 24% excluding contractual rights to call on additional capacity. APS expects that our
reserve margins will decrease over the next three years and that additional conventional resources will be needed around 2017.
Future Resources and Resource Plan
Under the ACC’s resource planning rule, APS will file by April 1 of each even year its resource plans for the next fifteen-year period. The
rule requires the ACC to issue an order with its acknowledgment of APS’s resource plan within approximately ten months following its submittal. The ACC’s
acknowledgment of APS’s resource plan will consider factors such as the total cost of electric energy services, demand management, analysis of supply-side
options, system reliability and risk management. APS will be filing its next resource plan by April 1, 2014.
Renewable Energy Standard
In 2006, the ACC adopted the RES. Under the RES, electric utilities that are regulated by the ACC must supply an increasing percentage of their
retail electric energy sales from eligible renewable resources, including solar, wind, biomass, biogas and geothermal technologies. The renewable energy
requirement is 4.5% of retail electric sales in 2014 and increases annually until it reaches 15% in 2025. In APS’s 2009 retail rate case settlement agreement
(the “2009 Settlement Agreement”), APS committed to have 1,700 GWh of new renewable resources in service by year-end 2015 in addition to its 2008
renewable resource commitments. Taken together, APS’s commitment is estimated to be approximately 12% of retail sales, by year-end 2015, which is more
than double the RES target of 5% for that year. A component of the RES is focused on stimulating development of distributed energy systems (generally
speaking, small-scale renewable technologies that are located on customers’ properties, such as rooftop solar systems). Accordingly, under the RES, an
increasing percentage of that requirement must be supplied from distributed energy resources. This distributed energy requirement is 30% of the overall RES
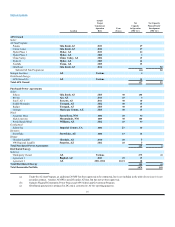
requirement of 4.5% in 2014. The following table summarizes the RES requirement standard (not including the additional commitment required by the 2009
Settlement Agreement) and its timing:
2014 2015 2020 2025
RES as a % of retail electric sales 4.5%5%10%15%
Percent of RES to be supplied from distributed energy
resources 30%30%30%30%
12