APS 2013 Annual Report Download - page 162
Download and view the complete annual report
Please find page 162 of the 2013 APS annual report below. You can navigate through the pages in the report by either clicking on the pages listed below, or by using the keyword search tool below to find specific information within the annual report.-
 1
1 -
2
-
3
-
4
-
5
-
6
-
7
-
8
-
9
-
10
-
11
-
12
-
13
-
14
-
15
-
16
-
17
-
18
-
19
-
20
-
21
-
22
-
23
-
24
-
25
-
26
-
27
-
28
-
29
-
30
-
31
-
32
-
33
-
34
-
35
-
36
-
37
-
38
-
39
-
40
-
41
-
42
-
43
-
44
-
45
-
46
-
47
-
48
-
49
-
50
-
51
-
52
-
53
-
54
-
55
-
56
-
57
-
58
-
59
-
60
-
61
-
62
-
63
-
64
-
65
-
66
-
67
-
68
-
69
-
70
-
71
-
72
-
73
-
74
-
75
-
76
-
77
-
78
-
79
-
80
-
81
-
82
-
83
-
84
-
85
-
86
-
87
-
88
-
89
-
90
-
91
-
92
-
93
-
94
-
95
-
96
-
97
-
98
-
99
-
100
-
101
-
102
-
103
-
104
-
105
-
106
-
107
-
108
-
109
-
110
-
111
-
112
-
113
-
114
-
115
-
116
-
117
-
118
-
119
-
120
-
121
-
122
-
123
-
124
-
125
-
126
-
127
-
128
-
129
-
130
-
131
-
132
-
133
-
134
-
135
-
136
-
137
-
138
-
139
-
140
-
141
-
142
-
143
-
144
-
145
-
146
-
147
-
148
-
149
-
150
-
151
-
 152
152 -
 153
153 -
 154
154 -
 155
155 -
 156
156 -
 157
157 -
 158
158 -
 159
159 -
 160
160 -
 161
161 -
 162
162 -
 163
163 -
 164
164 -
 165
165 -
 166
166 -
 167
167 -
 168
168 -
 169
169 -
 170
170 -
 171
171 -
 172
172 -
173
-
174
-
175
-
176
-
177
-
178
-
179
-
180
-
181
-
182
-
183
-
184
-
185
-
186
-
187
-
188
-
189
-
190
-
191
-
192
-
193
-
194
-
195
-
196
-
197
-
198
-
199
-
200
-
201
-
202
-
203
-
204
-
205
-
206
-
207
-
208
-
209
-
210
-
211
-
212
-
213
-
214
-
215
-
216
-
217
-
218
-
219
-
220
-
221
-
222
-
223
-
224
-
225
-
226
-
227
-
228
-
229
-
230
-
231
-
232
-
233
-
234
-
235
-
236
-
237
-
238
-
239
-
240
-
241
-
242
-
243
-
244
-
245
-
246
-
247
-
248
-
249
-
250
-
251
-
252
-
253
-
254
-
255
-
256
-
257
-
258
-
259
-
260
-
261
-
262
-
263
-
264
-
265
-
266
 |
 |

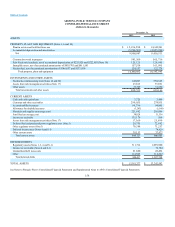
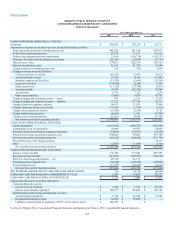
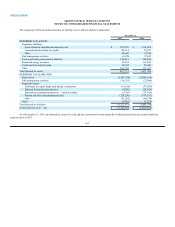
Table of Contents
ARIZONA PUBLIC SERVICE COMPANY
CONSOLIDATED BALANCE SHEETS
(dollars in thousands)
December 31,
2013 2012
ASSETS
PROPERTY, PLANT AND EQUIPMENT (Notes 1, 6 and 10)
Plant in service and held for future use $15,196,598 $14,342,501
Accumulated depreciation and amortization (5,296,501)(4,925,990)
Net 9,900,097 9,416,511
Construction work in progress 581,369 565,716
Palo Verde sale leaseback, net of accumulated depreciation of $225,925 and $222,055 (Note 19) 125,125 128,995
Intangible assets, net of accumulated amortization of $439,703 and $411,543 157,534 161,995
Nuclear fuel, net of accumulated amortization of $146,057 and $133,950 124,557 122,778
Total property, plant and equipment 10,888,682 10,395,995
INVESTMENTS AND OTHER ASSETS
Nuclear decommissioning trust (Notes 14 and 20) 642,007 570,625
Assets from risk management activities (Note 17) 23,815 35,891
Other assets 33,709 31,650
Total investments and other assets 699,531 638,166
CURRENT ASSETS
Cash and cash equivalents 3,725 3,499
Customer and other receivables 299,055 274,815
Accrued unbilled revenues 96,796 94,845
Allowance for doubtful accounts (3,203)(3,340)
Materials and supplies (at average cost) 221,682 218,096
Fossil fuel (at average cost) 38,028 31,334
Income tax receivable 135,179 589
Assets from risk management activities (Note 17) 17,169 25,699
Deferred fuel and purchased power regulatory asset (Note 3) 20,755 72,692
Other regulatory assets (Note 3) 76,388 71,257
Deferred income taxes (Notes 4 and S-1) —74,420
Other current assets 39,153 37,077
Total current assets 944,727 900,983
DEFERRED DEBITS
Regulatory assets (Notes 1, 3, 4 and S-1) 711,712 1,099,900
Income tax receivable (Notes 4 and S-1) —70,784
Unamortized debt issue costs 21,860 22,492
Other 114,865 114,222
Total deferred debits 848,437 1,307,398
TOTAL ASSETS $13,381,377 $ 13,242,542
See Notes to Pinnacle West’s Consolidated Financial Statements and Supplemental Notes to APS’s Consolidated Financial Statements.
158