APS 2013 Annual Report Download - page 177
Download and view the complete annual report
Please find page 177 of the 2013 APS annual report below. You can navigate through the pages in the report by either clicking on the pages listed below, or by using the keyword search tool below to find specific information within the annual report.-
 1
1 -
2
-
3
-
4
-
5
-
6
-
7
-
8
-
9
-
10
-
11
-
12
-
13
-
14
-
15
-
16
-
17
-
18
-
19
-
20
-
21
-
22
-
23
-
24
-
25
-
26
-
27
-
28
-
29
-
30
-
31
-
32
-
33
-
34
-
35
-
36
-
37
-
38
-
39
-
40
-
41
-
42
-
43
-
44
-
45
-
46
-
47
-
48
-
49
-
50
-
51
-
52
-
53
-
54
-
55
-
56
-
57
-
58
-
59
-
60
-
61
-
62
-
63
-
64
-
65
-
66
-
67
-
68
-
69
-
70
-
71
-
72
-
73
-
74
-
75
-
76
-
77
-
78
-
79
-
80
-
81
-
82
-
83
-
84
-
85
-
86
-
87
-
88
-
89
-
90
-
91
-
92
-
93
-
94
-
95
-
96
-
97
-
98
-
99
-
100
-
101
-
102
-
103
-
104
-
105
-
106
-
107
-
108
-
109
-
110
-
111
-
112
-
113
-
114
-
115
-
116
-
117
-
118
-
119
-
120
-
121
-
122
-
123
-
124
-
125
-
126
-
127
-
128
-
129
-
130
-
131
-
132
-
133
-
134
-
135
-
136
-
137
-
138
-
139
-
140
-
141
-
142
-
143
-
144
-
145
-
146
-
147
-
148
-
149
-
150
-
151
-
152
-
153
-
154
-
155
-
156
-
157
-
158
-
159
-
160
-
161
-
162
-
163
-
164
-
165
-
166
-
 167
167 -
 168
168 -
 169
169 -
 170
170 -
 171
171 -
 172
172 -
 173
173 -
 174
174 -
 175
175 -
 176
176 -
 177
177 -
 178
178 -
 179
179 -
 180
180 -
 181
181 -
 182
182 -
 183
183 -
 184
184 -
 185
185 -
 186
186 -
 187
187 -
188
-
189
-
190
-
191
-
192
-
193
-
194
-
195
-
196
-
197
-
198
-
199
-
200
-
201
-
202
-
203
-
204
-
205
-
206
-
207
-
208
-
209
-
210
-
211
-
212
-
213
-
214
-
215
-
216
-
217
-
218
-
219
-
220
-
221
-
222
-
223
-
224
-
225
-
226
-
227
-
228
-
229
-
230
-
231
-
232
-
233
-
234
-
235
-
236
-
237
-
238
-
239
-
240
-
241
-
242
-
243
-
244
-
245
-
246
-
247
-
248
-
249
-
250
-
251
-
252
-
253
-
254
-
255
-
256
-
257
-
258
-
259
-
260
-
261
-
262
-
263
-
264
-
265
-
266
 |
 |

Table of Contents
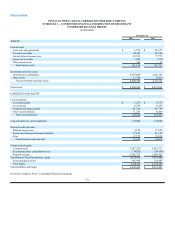
PINNACLE WEST CAPITAL CORPORATION HOLDING COMPANY
SCHEDULE I — CONDENSED FINANCIAL INFORMATION OF REGISTRANT
CONDENSED STATEMENTS OF CASH FLOWS
(in thousands)
Year Ended December 31,
2013 2012 2011
Cash flows from operating activities
Net income $406,074 $ 381,542 $ 339,473
Adjustments to reconcile net income to net cash provided by operating activities:
Equity in earnings of subsidiaries — net (420,926) (391,528)(335,859)
Depreciation and amortization 95 94 97
Gain on sale of energy-related business — — (10,404)
Deferred income taxes (28,806) (15,135) 7,387
Accounts receivable 21,671 28,763 (24,201)
Accounts payable (2,449)879 (2,677)
Accrued taxes and income tax receivables — net 1,402 (3,103)7,512
Dividends received from subsidiaries 242,100 222,200 228,900
Other (15,065)(4,589)19,270
Net cash flow provided by operating activities 204,096 219,123 229,498
Cash flows from investing activities
Investments in subsidiaries (3,400) — —
Repayments of loans from subsidiaries 2,149 996 61,143
Proceeds from sale of energy-related products and services business — — 45,111
Advances of loans to subsidiaries (2,099)(1,200) (64,970)
Proceeds from sale of life insurance policies — — 9,357
Net cash flow provided by (used for) investing activities (3,350)(204)50,641
Cash flows from financing activities
Issuance of long-term debt —125,000 175,000
Short-term borrowings and payments — net — — (16,600)
Dividends paid on common stock (235,244)(225,075) (221,728)
Repayment of long-term debt —(125,000)(225,000)
Common stock equity issuance 17,319 15,955 15,841
Other 298 170 (2,667)
Net cash flow used for financing activities (217,627) (208,950) (275,154)
Net increase (decrease) in cash and cash equivalents (16,881)9,969 4,985
Cash and cash equivalents at beginning of year 22,679 12,710 7,725
Cash and cash equivalents at end of year $5,798 $22,679 $ 12,710
See Notes to Pinnacle West’s Consolidated Financial Statements.
172