APS 2013 Annual Report Download - page 68
Download and view the complete annual report
Please find page 68 of the 2013 APS annual report below. You can navigate through the pages in the report by either clicking on the pages listed below, or by using the keyword search tool below to find specific information within the annual report.-
 1
1 -
2
-
3
-
4
-
5
-
6
-
7
-
8
-
9
-
10
-
11
-
12
-
13
-
14
-
15
-
16
-
17
-
18
-
19
-
20
-
21
-
22
-
23
-
24
-
25
-
26
-
27
-
28
-
29
-
30
-
31
-
32
-
33
-
34
-
35
-
36
-
37
-
38
-
39
-
40
-
41
-
42
-
43
-
44
-
45
-
46
-
47
-
48
-
49
-
50
-
51
-
52
-
53
-
54
-
55
-
56
-
57
-
 58
58 -
 59
59 -
 60
60 -
 61
61 -
 62
62 -
 63
63 -
 64
64 -
 65
65 -
 66
66 -
 67
67 -
 68
68 -
 69
69 -
 70
70 -
 71
71 -
 72
72 -
 73
73 -
 74
74 -
 75
75 -
 76
76 -
 77
77 -
 78
78 -
79
-
80
-
81
-
82
-
83
-
84
-
85
-
86
-
87
-
88
-
89
-
90
-
91
-
92
-
93
-
94
-
95
-
96
-
97
-
98
-
99
-
100
-
101
-
102
-
103
-
104
-
105
-
106
-
107
-
108
-
109
-
110
-
111
-
112
-
113
-
114
-
115
-
116
-
117
-
118
-
119
-
120
-
121
-
122
-
123
-
124
-
125
-
126
-
127
-
128
-
129
-
130
-
131
-
132
-
133
-
134
-
135
-
136
-
137
-
138
-
139
-
140
-
141
-
142
-
143
-
144
-
145
-
146
-
147
-
148
-
149
-
150
-
151
-
152
-
153
-
154
-
155
-
156
-
157
-
158
-
159
-
160
-
161
-
162
-
163
-
164
-
165
-
166
-
167
-
168
-
169
-
170
-
171
-
172
-
173
-
174
-
175
-
176
-
177
-
178
-
179
-
180
-
181
-
182
-
183
-
184
-
185
-
186
-
187
-
188
-
189
-
190
-
191
-
192
-
193
-
194
-
195
-
196
-
197
-
198
-
199
-
200
-
201
-
202
-
203
-
204
-
205
-
206
-
207
-
208
-
209
-
210
-
211
-
212
-
213
-
214
-
215
-
216
-
217
-
218
-
219
-
220
-
221
-
222
-
223
-
224
-
225
-
226
-
227
-
228
-
229
-
230
-
231
-
232
-
233
-
234
-
235
-
236
-
237
-
238
-
239
-
240
-
241
-
242
-
243
-
244
-
245
-
246
-
247
-
248
-
249
-
250
-
251
-
252
-
253
-
254
-
255
-
256
-
257
-
258
-
259
-
260
-
261
-
262
-
263
-
264
-
265
-
266
 |
 |

Table of Contents
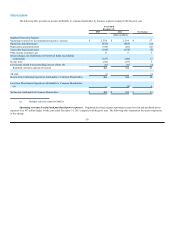
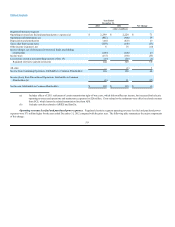
million in net cash used. The decrease in net cash used for financing activities is primarily due to $531 million in lower repayments of long-term debt, largely
offset by $340 million in lower issuances of long-term debt and a $31 million net change in APS’s commercial paper borrowings, which is classified as short-
term borrowings on the Consolidated Balance Sheets. On December 30, 2013, commercial paper issuances were used to fund the acquisition of SCE’s 48%
ownership interest in each of Units 4 and 5 of Four Corners (see below).
2012 Compared with 2011. Pinnacle West’s consolidated net cash used for financing activities was $305 million in 2012, compared to $420
million in 2011, a decrease of $115 million in net cash used. The decrease in net cash used for financing activities is primarily due to an increase of $92
million in APS’s short-term debt borrowings in 2012. In addition, APS had $56 million in higher issuances of long-term debt, partially offset by $99
million in higher repayments of long-term debt. Pinnacle West had $100 million in lower repayments of long-term debt, partially offset by $50 million in
lower debt issuances (see below).
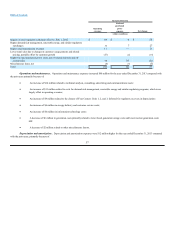
Significant Financing Activities. On December 18, 2013, the Pinnacle West Board of Directors declared a quarterly dividend of $0.5675 per
share of common stock, payable on March 3, 2014, to shareholders of record on February 3, 2014. During 2013, Pinnacle West increased its indicated
annual dividend from $2.18 per share to $2.27 per share. For the year ended December 31, 2013, Pinnacle West’s total dividends paid per share of common
stock were $2.20 per share, which resulted in dividend payments of $235 million.
On March 22, 2013, APS issued an additional $100 million par amount of its outstanding 4.50% unsecured senior notes that mature on April 1,
2042. The net proceeds from the sale were used to repay short-term commercial paper borrowings and replenish cash used to redeem certain tax-exempt
indebtedness in November 2012.
On May 1, 2013, APS purchased all $32 million of the Maricopa County, Arizona Pollution Control Corporation Pollution Control Revenue
Refunding Bonds, 2009 Series C, due 2029. On May 28, 2013, we remarketed the bonds. The interest rate for these bonds was set to a new term rate. The
new term rate for these bonds ends, subject to a mandatory tender, on May 30, 2018. During this time, the bonds will bear interest at a rate of 1.75% per
annum. These bonds are classified as long-term debt on our Consolidated Balance Sheets at December 31, 2013 and were classified as current maturities of
long-term debt on our Consolidated Balance Sheets at December 31, 2012.
On July 12, 2013, APS purchased all $33 million of the Coconino County, Arizona Pollution Control Corporation Pollution Control Revenue
Refunding Bonds, 1994 Series A, due 2029. On January 15, 2014, these bonds were canceled. These bonds were classified as current maturities of long-
term debt on our Consolidated Balance Sheets at December 31, 2012.
On October 11, 2013, APS purchased all $32 million of the City of Farmington, New Mexico Pollution Control Revenue Bonds, 1994 Series C, due
2024. On January 15, 2014, these bonds were canceled. These bonds were classified as current maturities of long-term debt on our Consolidated Balance
Sheets at December 31, 2012.
On January 10, 2014, APS issued $250 million of 4.70% unsecured senior notes that mature on January 15, 2044. The proceeds from the sale were
used to repay commercial paper which was used to fund the purchase price and costs associated with the acquisition of SCE’s 48% ownership interest in
65