APS 2013 Annual Report Download - page 85
Download and view the complete annual report
Please find page 85 of the 2013 APS annual report below. You can navigate through the pages in the report by either clicking on the pages listed below, or by using the keyword search tool below to find specific information within the annual report.-
 1
1 -
2
-
3
-
4
-
5
-
6
-
7
-
8
-
9
-
10
-
11
-
12
-
13
-
14
-
15
-
16
-
17
-
18
-
19
-
20
-
21
-
22
-
23
-
24
-
25
-
26
-
27
-
28
-
29
-
30
-
31
-
32
-
33
-
34
-
35
-
36
-
37
-
38
-
39
-
40
-
41
-
42
-
43
-
44
-
45
-
46
-
47
-
48
-
49
-
50
-
51
-
52
-
53
-
54
-
55
-
56
-
57
-
58
-
59
-
60
-
61
-
62
-
63
-
64
-
65
-
66
-
67
-
68
-
69
-
70
-
71
-
72
-
73
-
74
-
 75
75 -
 76
76 -
 77
77 -
 78
78 -
 79
79 -
 80
80 -
 81
81 -
 82
82 -
 83
83 -
 84
84 -
 85
85 -
 86
86 -
 87
87 -
 88
88 -
 89
89 -
 90
90 -
 91
91 -
 92
92 -
 93
93 -
 94
94 -
 95
95 -
96
-
97
-
98
-
99
-
100
-
101
-
102
-
103
-
104
-
105
-
106
-
107
-
108
-
109
-
110
-
111
-
112
-
113
-
114
-
115
-
116
-
117
-
118
-
119
-
120
-
121
-
122
-
123
-
124
-
125
-
126
-
127
-
128
-
129
-
130
-
131
-
132
-
133
-
134
-
135
-
136
-
137
-
138
-
139
-
140
-
141
-
142
-
143
-
144
-
145
-
146
-
147
-
148
-
149
-
150
-
151
-
152
-
153
-
154
-
155
-
156
-
157
-
158
-
159
-
160
-
161
-
162
-
163
-
164
-
165
-
166
-
167
-
168
-
169
-
170
-
171
-
172
-
173
-
174
-
175
-
176
-
177
-
178
-
179
-
180
-
181
-
182
-
183
-
184
-
185
-
186
-
187
-
188
-
189
-
190
-
191
-
192
-
193
-
194
-
195
-
196
-
197
-
198
-
199
-
200
-
201
-
202
-
203
-
204
-
205
-
206
-
207
-
208
-
209
-
210
-
211
-
212
-
213
-
214
-
215
-
216
-
217
-
218
-
219
-
220
-
221
-
222
-
223
-
224
-
225
-
226
-
227
-
228
-
229
-
230
-
231
-
232
-
233
-
234
-
235
-
236
-
237
-
238
-
239
-
240
-
241
-
242
-
243
-
244
-
245
-
246
-
247
-
248
-
249
-
250
-
251
-
252
-
253
-
254
-
255
-
256
-
257
-
258
-
259
-
260
-
261
-
262
-
263
-
264
-
265
-
266
 |
 |

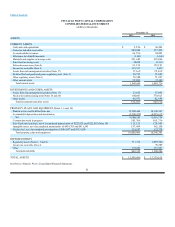
Table of Contents
PINNACLE WEST CAPITAL CORPORATION
CONSOLIDATED BALANCE SHEETS
(dollars in thousands)
December 31,
2013 2012
ASSETS
CURRENT ASSETS
Cash and cash equivalents $9,526 $26,202
Customer and other receivables 299,904 277,225
Accrued unbilled revenues 96,796 94,845
Allowance for doubtful accounts (3,203)(3,340)
Materials and supplies (at average cost) 221,682 218,096
Fossil fuel (at average cost) 38,028 31,334
Deferred income taxes (Note 4) 91,152 152,191
Income tax receivable (Note 4) 135,517 2,423
Assets from risk management activities (Note 17) 17,169 25,699
Deferred fuel and purchased power regulatory asset (Note 3) 20,755 72,692
Other regulatory assets (Note 3) 76,388 71,257
Other current assets 39,895 37,102
Total current assets 1,043,609 1,005,726
INVESTMENTS AND OTHER ASSETS
Assets from risk management activities (Note 17) 23,815 35,891
Nuclear decommissioning trust (Notes 14 and 20) 642,007 570,625
Other assets 60,875 62,694
Total investments and other assets 726,697 669,210
PROPERTY, PLANT AND EQUIPMENT (Notes 1, 6 and 10)
Plant in service and held for future use 15,200,464 14,346,367
Accumulated depreciation and amortization (5,300,219) (4,929,613)
Net 9,900,245 9,416,754
Construction work in progress 581,369 565,716
Palo Verde sale leaseback, net of accumulated depreciation of $225,925 and $222,055 (Note 19) 125,125 128,995
Intangible assets, net of accumulated amortization of $439,703 and $411,543 157,689 162,150
Nuclear fuel, net of accumulated amortization of $146,057 and $133,950 124,557 122,778
Total property, plant and equipment 10,888,985 10,396,393
DEFERRED DEBITS
Regulatory assets (Notes 1, 3 and 4) 711,712 1,099,900
Income tax receivable (Note 4) — 70,389
Other 137,683 137,997
Total deferred debits 849,395 1,308,286
TOTAL ASSETS $13,508,686 $13,379,615
See Notes to Pinnacle West’s Consolidated Financial Statements.
82