APS 2013 Annual Report Download - page 164
Download and view the complete annual report
Please find page 164 of the 2013 APS annual report below. You can navigate through the pages in the report by either clicking on the pages listed below, or by using the keyword search tool below to find specific information within the annual report.-
 1
1 -
2
-
3
-
4
-
5
-
6
-
7
-
8
-
9
-
10
-
11
-
12
-
13
-
14
-
15
-
16
-
17
-
18
-
19
-
20
-
21
-
22
-
23
-
24
-
25
-
26
-
27
-
28
-
29
-
30
-
31
-
32
-
33
-
34
-
35
-
36
-
37
-
38
-
39
-
40
-
41
-
42
-
43
-
44
-
45
-
46
-
47
-
48
-
49
-
50
-
51
-
52
-
53
-
54
-
55
-
56
-
57
-
58
-
59
-
60
-
61
-
62
-
63
-
64
-
65
-
66
-
67
-
68
-
69
-
70
-
71
-
72
-
73
-
74
-
75
-
76
-
77
-
78
-
79
-
80
-
81
-
82
-
83
-
84
-
85
-
86
-
87
-
88
-
89
-
90
-
91
-
92
-
93
-
94
-
95
-
96
-
97
-
98
-
99
-
100
-
101
-
102
-
103
-
104
-
105
-
106
-
107
-
108
-
109
-
110
-
111
-
112
-
113
-
114
-
115
-
116
-
117
-
118
-
119
-
120
-
121
-
122
-
123
-
124
-
125
-
126
-
127
-
128
-
129
-
130
-
131
-
132
-
133
-
134
-
135
-
136
-
137
-
138
-
139
-
140
-
141
-
142
-
143
-
144
-
145
-
146
-
147
-
148
-
149
-
150
-
151
-
152
-
153
-
 154
154 -
 155
155 -
 156
156 -
 157
157 -
 158
158 -
 159
159 -
 160
160 -
 161
161 -
 162
162 -
 163
163 -
 164
164 -
 165
165 -
 166
166 -
 167
167 -
 168
168 -
 169
169 -
 170
170 -
 171
171 -
 172
172 -
 173
173 -
 174
174 -
175
-
176
-
177
-
178
-
179
-
180
-
181
-
182
-
183
-
184
-
185
-
186
-
187
-
188
-
189
-
190
-
191
-
192
-
193
-
194
-
195
-
196
-
197
-
198
-
199
-
200
-
201
-
202
-
203
-
204
-
205
-
206
-
207
-
208
-
209
-
210
-
211
-
212
-
213
-
214
-
215
-
216
-
217
-
218
-
219
-
220
-
221
-
222
-
223
-
224
-
225
-
226
-
227
-
228
-
229
-
230
-
231
-
232
-
233
-
234
-
235
-
236
-
237
-
238
-
239
-
240
-
241
-
242
-
243
-
244
-
245
-
246
-
247
-
248
-
249
-
250
-
251
-
252
-
253
-
254
-
255
-
256
-
257
-
258
-
259
-
260
-
261
-
262
-
263
-
264
-
265
-
266
 |
 |

Table of Contents
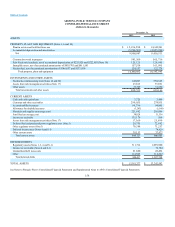
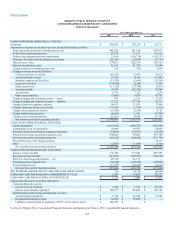
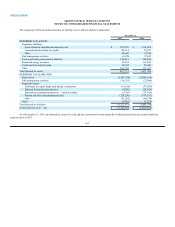
ARIZONA PUBLIC SERVICE COMPANY
CONSOLIDATED STATEMENTS OF CASH FLOWS
(dollars in thousands)
Year Ended December 31,
2013 2012 2011
CASH FLOWS FROM OPERATING ACTIVITIES
Net income $458,861 $427,110 $363,773
Adjustments to reconcile net income to net cash provided by operating activities:
Depreciation and amortization including nuclear fuel 492,226 481,168 493,653
Deferred fuel and purchased power 21,678 71,573 69,166
Deferred fuel and purchased power amortization 31,190 (116,716)(155,157)
Allowance for equity funds used during construction (25,581)(22,436)(23,707)
Deferred income taxes 278,101 202,159 110,565
Deferred investment tax credit 52,542 41,579 58,240
Change in derivative instruments fair value 534 (749)4,064
Changes in current assets and liabilities:
Customer and other receivables (46,552)12,914 34,913
Accrued unbilled revenues (1,951)30,394 (21,947)
Materials, supplies and fossil fuel (11,878)(23,043)(23,398)
Income tax receivable (134,590)(2,280)2,869
Other current assets (17,112) (27,745) (5,473)
Accounts payable 47,870 (97,395)73,369
Accrued taxes 5,760 7,330 2,234
Other current liabilities (9,005) 6,070 18,762
Change in margin and collateral accounts — assets 993 2,216 33,349
Change in margin and collateral accounts — liabilities 12,355 137,785 29,731
Change in long-term regulatory liabilities 64,473 13,539 37,009
Change in long-term income tax receivable 137,665 (1,756)(3,530)
Change in unrecognized tax benefits (91,244) (2,583) 9,125
Change in other long-term assets (46,043)1,391 (41,788)
Change in other long-term liabilities (25,601)34,854 61,990
Net cash flow provided by operating activities 1,194,691 1,175,379 1,127,812
CASH FLOWS FROM INVESTING ACTIVITIES
Capital expenditures (1,016,322) (889,551)(878,546)
Contributions in aid of construction 41,090 49,876 38,096
Allowance for borrowed funds used during construction (14,861) (14,971) (18,358)
Proceeds from nuclear decommissioning trust sales 446,025 417,603 497,780
Investment in nuclear decommissioning trust (463,274)(434,852)(513,799)
Proceeds from sale of life insurance policies — — 44,183
Other (2,067) (1,099)(3,306)
Net cash flow used for investing activities (1,009,409)(872,994)(833,950)
CASH FLOWS FROM FINANCING ACTIVITIES
Issuance of long-term debt 136,307 351,081 295,353
Repayment of long-term debt (122,828) (529,286)(430,169)
Short-term borrowings and payments — net 60,950 92,175 —
Dividends paid on common stock (242,100)(222,200)(228,900)
Noncontrolling interests (17,385) (10,529)(10,210)
Net cash flow used for financing activities (185,056)(318,759) (373,926)
NET INCREASE (DECREASE) IN CASH AND CASH EQUIVALENTS 226 (16,374)(80,064)
CASH AND CASH EQUIVALENTS AT BEGINNING OF YEAR 3,499 19,873 99,937
CASH AND CASH EQUIVALENTS AT END OF YEAR $3,725 $3,499 $19,873
Supplemental disclosure of cash flow information:
Cash paid during the year for:
Income taxes, net of refunds $7,524 $1,196 $25,975
Interest, net of amounts capitalized $180,757 $196,038 $210,995
Significant non-cash investing and financing activities:
Accrued capital expenditures $33,184 $26,208 $27,245
Dividends declared but not paid $62,500 $59,800 $ —
Liabilities assumed related to acquisition of SCE’s Four Corners’ interest $145,609 $ — $ —
See Notes to Pinnacle West’s Consolidated Financial Statements and Supplemental Notes to APS’s Consolidated Financial Statements.
160