APS 2013 Annual Report Download - page 110
Download and view the complete annual report
Please find page 110 of the 2013 APS annual report below. You can navigate through the pages in the report by either clicking on the pages listed below, or by using the keyword search tool below to find specific information within the annual report.-
 1
1 -
2
-
3
-
4
-
5
-
6
-
7
-
8
-
9
-
10
-
11
-
12
-
13
-
14
-
15
-
16
-
17
-
18
-
19
-
20
-
21
-
22
-
23
-
24
-
25
-
26
-
27
-
28
-
29
-
30
-
31
-
32
-
33
-
34
-
35
-
36
-
37
-
38
-
39
-
40
-
41
-
42
-
43
-
44
-
45
-
46
-
47
-
48
-
49
-
50
-
51
-
52
-
53
-
54
-
55
-
56
-
57
-
58
-
59
-
60
-
61
-
62
-
63
-
64
-
65
-
66
-
67
-
68
-
69
-
70
-
71
-
72
-
73
-
74
-
75
-
76
-
77
-
78
-
79
-
80
-
81
-
82
-
83
-
84
-
85
-
86
-
87
-
88
-
89
-
90
-
91
-
92
-
93
-
94
-
95
-
96
-
97
-
98
-
99
-
 100
100 -
 101
101 -
 102
102 -
 103
103 -
 104
104 -
 105
105 -
 106
106 -
 107
107 -
 108
108 -
 109
109 -
 110
110 -
 111
111 -
 112
112 -
 113
113 -
 114
114 -
 115
115 -
 116
116 -
 117
117 -
 118
118 -
 119
119 -
 120
120 -
121
-
122
-
123
-
124
-
125
-
126
-
127
-
128
-
129
-
130
-
131
-
132
-
133
-
134
-
135
-
136
-
137
-
138
-
139
-
140
-
141
-
142
-
143
-
144
-
145
-
146
-
147
-
148
-
149
-
150
-
151
-
152
-
153
-
154
-
155
-
156
-
157
-
158
-
159
-
160
-
161
-
162
-
163
-
164
-
165
-
166
-
167
-
168
-
169
-
170
-
171
-
172
-
173
-
174
-
175
-
176
-
177
-
178
-
179
-
180
-
181
-
182
-
183
-
184
-
185
-
186
-
187
-
188
-
189
-
190
-
191
-
192
-
193
-
194
-
195
-
196
-
197
-
198
-
199
-
200
-
201
-
202
-
203
-
204
-
205
-
206
-
207
-
208
-
209
-
210
-
211
-
212
-
213
-
214
-
215
-
216
-
217
-
218
-
219
-
220
-
221
-
222
-
223
-
224
-
225
-
226
-
227
-
228
-
229
-
230
-
231
-
232
-
233
-
234
-
235
-
236
-
237
-
238
-
239
-
240
-
241
-
242
-
243
-
244
-
245
-
246
-
247
-
248
-
249
-
250
-
251
-
252
-
253
-
254
-
255
-
256
-
257
-
258
-
259
-
260
-
261
-
262
-
263
-
264
-
265
-
266
 |
 |
Table of Contents
PINNACLE WEST CAPITAL CORPORATION
NOTES TO CONSOLIDATED FINANCIAL STATEMENTS
million, with a corresponding decrease in accumulated deferred income tax liabilities, to reflect the impact of this change in tax law.
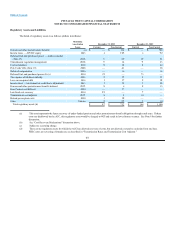
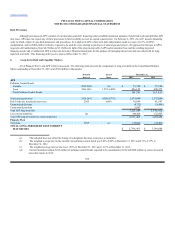
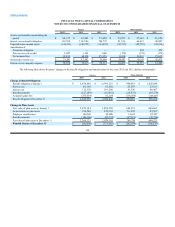
The components of the net deferred income tax liability were as follows (dollars in thousands):
December 31,
2013 2012
DEFERRED TAX ASSETS
Risk management activities $44,920 $72,243
Regulatory liabilities:
Asset retirement obligation and removal costs 235,959 238,669
Unamortized investment tax credits 82,116 53,837
Other 42,609 33,764
Pension and other postretirement liabilities 198,642 408,764
Renewable energy incentives 65,434 66,941
Credit and loss carryforwards 133,070 139,022
Other 148,492 68,844
Total deferred tax assets 951,242 1,082,084
DEFERRED TAX LIABILITIES
Plant-related (2,903,730)(2,584,166)
Risk management activities (16,191)(23,940)
Regulatory assets:
Allowance for equity funds used during construction (43,058)(37,899)
Deferred fuel and purchased power (8,282) (28,858)
Deferred fuel and purchased power — mark-to-market (13,343)(15,796)
Pension and other postretirement benefits (129,250)(316,757)
Other (93,202) (68,170)
Other (4,916)(5,678)
Total deferred tax liabilities (3,211,972)(3,081,264)
Deferred income taxes — net $(2,260,730)$(1,999,180)
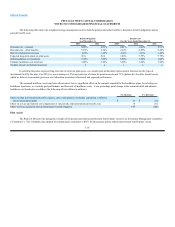
As of December 31, 2013, the deferred tax assets for credit and loss carryforwards relate to federal general business credits of $131 million which
first begin to expire in 2031, and other federal and state loss carryforwards of $2 million which first begin to expire in 2018.
106