Singapore Airlines 2016 Annual Report Download - page 73
Download and view the complete annual report
Please find page 73 of the 2016 Singapore Airlines annual report below. You can navigate through the pages in the report by either clicking on the pages listed below, or by using the keyword search tool below to find specific information within the annual report.-
 1
1 -
2
-
3
-
4
-
5
-
6
-
7
-
8
-
9
-
10
-
11
-
12
-
13
-
14
-
15
-
16
-
17
-
18
-
19
-
20
-
21
-
22
-
23
-
24
-
25
-
26
-
27
-
28
-
29
-
30
-
31
-
32
-
33
-
34
-
35
-
36
-
37
-
38
-
39
-
40
-
41
-
42
-
43
-
44
-
45
-
46
-
47
-
48
-
49
-
50
-
51
-
52
-
53
-
54
-
55
-
56
-
57
-
58
-
59
-
60
-
61
-
62
-
 63
63 -
 64
64 -
 65
65 -
 66
66 -
 67
67 -
 68
68 -
 69
69 -
 70
70 -
 71
71 -
 72
72 -
 73
73 -
 74
74 -
 75
75 -
 76
76 -
 77
77 -
 78
78 -
 79
79 -
 80
80 -
 81
81 -
 82
82 -
 83
83 -
84
-
85
-
86
-
87
-
88
-
89
-
90
-
91
-
92
-
93
-
94
-
95
-
96
-
97
-
98
-
99
-
100
-
101
-
102
-
103
-
104
-
105
-
106
-
107
-
108
-
109
-
110
-
111
-
112
-
113
-
114
-
115
-
116
-
117
-
118
-
119
-
120
-
121
-
122
-
123
-
124
-
125
-
126
-
127
-
128
-
129
-
130
-
131
-
132
-
133
-
134
-
135
-
136
-
137
-
138
-
139
-
140
-
141
-
142
-
143
-
144
-
145
-
146
-
147
-
148
-
149
-
150
-
151
-
152
-
153
-
154
-
155
-
156
-
157
-
158
-
159
-
160
-
161
-
162
-
163
-
164
-
165
-
166
-
167
-
168
-
169
-
170
-
171
-
172
-
173
-
174
-
175
-
176
-
177
-
178
-
179
-
180
-
181
-
182
-
183
-
184
-
185
-
186
-
187
-
188
-
189
-
190
-
191
-
192
-
193
-
194
-
195
-
196
-
197
-
198
-
199
-
200
-
201
-
202
-
203
-
204
-
205
-
206
-
207
-
208
-
209
-
210
-
211
-
212
-
213
-
214
-
215
-
216
-
217
-
218
-
219
-
220
-
221
-
222
-
223
-
224
-
225
-
226
-
227
-
228
-
229
-
230
-
231
-
232
 |
 |

For FY2015/16 the aggregate total remuneration paid to
the Relevant Key Management Personnel (who are not
Directors or the CEO) amounted to $4,213,026.
For FY2015/16, there were no termination, retirement or
post-employment benefits granted to Directors, the CEO
and Relevant Key Management Personnel other than the
standard contractual notice period termination payment
in lieu of service, and the post-retirement travel benefits for
the CEO and Relevant Key Management Personnel.
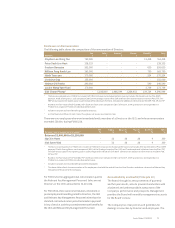
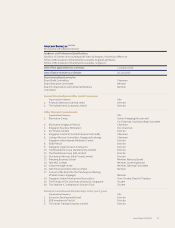
Disclosure on Remuneration
The following table shows the composition of the remuneration of Directors.
Directors
Fee
$
Salary
$
Bonuses1
$
Shares2
$
Benefits3
$
Total
$
Stephen Lee Ching Yen 750,000 - - - 11,419 761,419
Peter Seah Lim Huat 138,333 - - - - 138,333
Gautam Banerjee 205,000 - - - 630 205,630
William Fung Kwok Lun 165,000 - - - 790 165,790
Hsieh Tsun-yan 170,000 - - - 234 170,234
Christina Ong 155,000 - - - - 155,000
Helmut G W Panke 240,000 - - - 540 240,540
Lucien Wong Yuen Kuai 170,000 - - - 3,709 173,709
Goh Choon Phong4- 1,185,800 1,966,544 1,259,931 134,724 4,546,999
1 The bonuses were paid out in FY2015/16 in respect of FY2014/15 Group and individual performance and includes EVA-based Incentive Plan (EBIP)
payment, Profit-Sharing Bonus, cash component [50%] of the Strategic Incentive Plan (SIP) and Transformational Initiatives Incentive Plan (TIP). The
EBIP amount paid in the reporting year is a percentage of the individual’s EVA Bank. See above for additional information on the EBIP, PSB, SIP and TIP.
2 Based on the Fair Values of RSP ($10.00), PSP ($6.58) and DSA (share component [50%] of the SIP; $8.89) granted on a contingent basis in
FY2015/16 in respect of FY2014/15 individual performance.
3 Includes transport and travel benefits provided to Directors.
4 As Chief Executive Oicer, Mr Goh Choon Phong does not receive any Director’s fees.
There were no employees who were immediate family members of a Director or the CEO, and whose remuneration
exceeded $50,000, during FY2015/16.
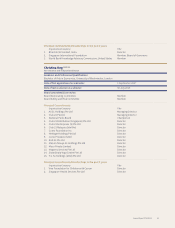
Relevant Key Management Personnel4
Fee
%
Salary
%
Bonuses1
%
Shares2
%
Benefits3
%
Total
%
Between $2,000,000 to $2,250,000
Ng Chin Hwee - 32 36 28 4 100
Mak Swee Wah - 32 36 28 4 100
1 The bonuses were paid out in FY2015/16 in respect of FY2014/15 Group and individual performance and includes EVA-based Incentive Plan (EBIP)
payment, Profit-Sharing Bonus, cash component [50%] of the Strategic Incentive Plan (SIP) and Transformational Initiatives Incentive Plan (TIP).
The EBIP amount paid in the reporting year is a percentage of the individual’s EVA Bank. See above for additional information on the EBIP, PSB,
SIP and TIP.
2 Based on the Fair Values of RSP ($10.00), PSP ($6.58) and DSA (share component [50%] of the SIP; $8.89) granted on a contingent basis in
FY2015/16 in respect of FY2014/15 individual performance.
3 Includes transport and travel benefits provided to employees.
4 The above table reflects the remuneration of the employees who hold the rank of Executive Vice President and above, who are the Relevant Key
Management Personnel of the Company.
Accountability and Audit (Principle 10)
The Board, through its announcements of quarterly
and full-year results, aims to provide shareholders with
a balanced and understandable assessment of the
Company’s performance and prospects. Management
provides the Board with monthly management accounts
for the Board’s review.
The Company has clear policies and guidelines for
dealings in securities by Directors and employees. The
Annual Report FY2015/16 71