Singapore Airlines 2016 Annual Report Download - page 219
Download and view the complete annual report
Please find page 219 of the 2016 Singapore Airlines annual report below. You can navigate through the pages in the report by either clicking on the pages listed below, or by using the keyword search tool below to find specific information within the annual report.-
 1
1 -
2
-
3
-
4
-
5
-
6
-
7
-
8
-
9
-
10
-
11
-
12
-
13
-
14
-
15
-
16
-
17
-
18
-
19
-
20
-
21
-
22
-
23
-
24
-
25
-
26
-
27
-
28
-
29
-
30
-
31
-
32
-
33
-
34
-
35
-
36
-
37
-
38
-
39
-
40
-
41
-
42
-
43
-
44
-
45
-
46
-
47
-
48
-
49
-
50
-
51
-
52
-
53
-
54
-
55
-
56
-
57
-
58
-
59
-
60
-
61
-
62
-
63
-
64
-
65
-
66
-
67
-
68
-
69
-
70
-
71
-
72
-
73
-
74
-
75
-
76
-
77
-
78
-
79
-
80
-
81
-
82
-
83
-
84
-
85
-
86
-
87
-
88
-
89
-
90
-
91
-
92
-
93
-
94
-
95
-
96
-
97
-
98
-
99
-
100
-
101
-
102
-
103
-
104
-
105
-
106
-
107
-
108
-
109
-
110
-
111
-
112
-
113
-
114
-
115
-
116
-
117
-
118
-
119
-
120
-
121
-
122
-
123
-
124
-
125
-
126
-
127
-
128
-
129
-
130
-
131
-
132
-
133
-
134
-
135
-
136
-
137
-
138
-
139
-
140
-
141
-
142
-
143
-
144
-
145
-
146
-
147
-
148
-
149
-
150
-
151
-
152
-
153
-
154
-
155
-
156
-
157
-
158
-
159
-
160
-
161
-
162
-
163
-
164
-
165
-
166
-
167
-
168
-
169
-
170
-
171
-
172
-
173
-
174
-
175
-
176
-
177
-
178
-
179
-
180
-
181
-
182
-
183
-
184
-
185
-
186
-
187
-
188
-
189
-
190
-
191
-
192
-
193
-
194
-
195
-
196
-
197
-
198
-
199
-
200
-
201
-
202
-
203
-
204
-
205
-
206
-
207
-
208
-
 209
209 -
 210
210 -
 211
211 -
 212
212 -
 213
213 -
 214
214 -
 215
215 -
 216
216 -
 217
217 -
 218
218 -
 219
219 -
 220
220 -
 221
221 -
 222
222 -
 223
223 -
 224
224 -
 225
225 -
 226
226 -
 227
227 -
 228
228 -
 229
229 -
230
-
231
-
232
 |
 |

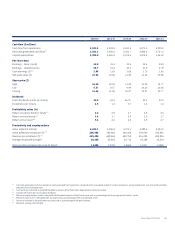
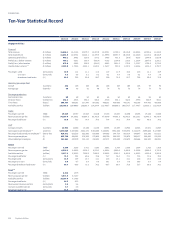
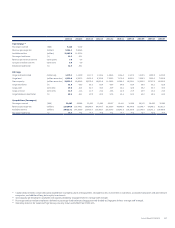
2015/16 2014/15 2013/14 2012/13 2011/12 2010/11 2009/10 2008/09 2007/08 2006/07
Tiger Airways R4
Passengers carried (‘000) 5,128 5,140
Revenue passenger-km (million) 9,551.1 9,696.3
Available seat-km (million) 11,465.4 11,812.4
Passenger load factor (%) 83.3 82.1
Revenue per revenue seat-km (cents/pkm) 7.0 6.8
Cost per available seat-km (cents/ask) 5.8 6.0
Breakeven load factor (%) 82.9 88.2
SIA Cargo
Cargo and mail carried (million kg) 1,170.1 1,124.0 1,117.8 1,144.6 1,205.8 1,156.4 1,122.4 1,219.5 1,308.0 1,284.9
Cargo load (million tonne-km) 6,510.9 6,347.2 6,419.3 6,763.6 7,198.2 7,174.0 6,659.1 7,299.3 7,959.2 7,995.6
Gross capacity (million tonne-km) 10,513.3 10,024.9 10,273.6 10,661.0 11,286.5 11,208.5 10,510.1 12,292.5 12,787.8 12,889.8
Cargo load factor (%) 61.9 63.3 62.5 63.4 63.8 64.0 63.4 59.4 62.2 62.0
Cargo yield (cents/ltk) 29.0 32.8 32.7 33.4 34.9 36.2 32.0 38.2 38.7 38.4
Cargo unit cost (cents/ctk) 18.9 21.4 21.9 23.2 23.5 22.3 21.9 24.9 23.4 24.5
Cargo breakeven load factor (%) 65.2 65.2 67.0 69.5 67.3 61.6 68.4 65.2 60.5 63.8
Group Airlines (Passengers)
Passengers carried (‘000) 30,405 29,308 22,039 21,505 20,187 19,411 18,836 20,247 20,935 19,962
Revenue passenger-km (million) 119,008.6 116,489.1 100,580.4 98,988.7 92,293.4 88,840.9 86,348.9 93,286.7 94,580.1 91,861.7
Available seat-km (million) 149,217.1 148,339.0 128,429.7 125,360.7 119,314.5 113,345.3 110,169.6 122,143.9 118,242.1 116,409.6
Passenger load factor (%) 79.8 78.5 78.3 79.0 77.4 78.4 78.4 76.4 80.0 78.9
R1 Capital disbursements comprised capital expenditure in property, plant and equipment, intangible assets, investments in subsidiary, associated companies and joint venture
companies, and additional long-term equity investments.
R2 Seat capacity per employee is available seat capacity divided by Singapore Airlines’ average sta strength.
R3 Passenger load carried per employee is defined as passenger load and excess baggage carried divided by Singapore Airlines’ average sta strength.
R4 Operating statistics for Scoot and Tiger Airways are only shown with eect from FY2014/15.
Annual Report FY2015/16 217