Singapore Airlines 2016 Annual Report Download - page 56
Download and view the complete annual report
Please find page 56 of the 2016 Singapore Airlines annual report below. You can navigate through the pages in the report by either clicking on the pages listed below, or by using the keyword search tool below to find specific information within the annual report.-
 1
1 -
2
-
3
-
4
-
5
-
6
-
7
-
8
-
9
-
10
-
11
-
12
-
13
-
14
-
15
-
16
-
17
-
18
-
19
-
20
-
21
-
22
-
23
-
24
-
25
-
26
-
27
-
28
-
29
-
30
-
31
-
32
-
33
-
34
-
35
-
36
-
37
-
38
-
39
-
40
-
41
-
42
-
43
-
44
-
45
-
 46
46 -
 47
47 -
 48
48 -
 49
49 -
 50
50 -
 51
51 -
 52
52 -
 53
53 -
 54
54 -
 55
55 -
 56
56 -
 57
57 -
 58
58 -
 59
59 -
 60
60 -
 61
61 -
 62
62 -
 63
63 -
 64
64 -
 65
65 -
 66
66 -
67
-
68
-
69
-
70
-
71
-
72
-
73
-
74
-
75
-
76
-
77
-
78
-
79
-
80
-
81
-
82
-
83
-
84
-
85
-
86
-
87
-
88
-
89
-
90
-
91
-
92
-
93
-
94
-
95
-
96
-
97
-
98
-
99
-
100
-
101
-
102
-
103
-
104
-
105
-
106
-
107
-
108
-
109
-
110
-
111
-
112
-
113
-
114
-
115
-
116
-
117
-
118
-
119
-
120
-
121
-
122
-
123
-
124
-
125
-
126
-
127
-
128
-
129
-
130
-
131
-
132
-
133
-
134
-
135
-
136
-
137
-
138
-
139
-
140
-
141
-
142
-
143
-
144
-
145
-
146
-
147
-
148
-
149
-
150
-
151
-
152
-
153
-
154
-
155
-
156
-
157
-
158
-
159
-
160
-
161
-
162
-
163
-
164
-
165
-
166
-
167
-
168
-
169
-
170
-
171
-
172
-
173
-
174
-
175
-
176
-
177
-
178
-
179
-
180
-
181
-
182
-
183
-
184
-
185
-
186
-
187
-
188
-
189
-
190
-
191
-
192
-
193
-
194
-
195
-
196
-
197
-
198
-
199
-
200
-
201
-
202
-
203
-
204
-
205
-
206
-
207
-
208
-
209
-
210
-
211
-
212
-
213
-
214
-
215
-
216
-
217
-
218
-
219
-
220
-
221
-
222
-
223
-
224
-
225
-
226
-
227
-
228
-
229
-
230
-
231
-
232
 |
 |

Financial Review
Performance of the Company
(continued)
R6 Depreciation included impairment of property, plant and equipment and amortisation of computer soware.
R7 Sales costs included commissions and incentives, frequent flyer programme cost, computer reservation system booking fees, advertising expenses,
reservation system IT cost and other sales costs.
R8 Communication and information technology costs were for data transmission and contract service fees, hire of computer equipment, maintenance/
rental of soware, and information technology contract and professional fees.
R9 Other costs mainly comprised crew expenses, company accommodation cost, foreign exchange revaluation and hedging loss, comprehensive aviation
insurance cost, airport lounge expenses, non-information technology contract and professional fees, expenses incurred to mount non-scheduled
services, aircra licence fees and recoveries.
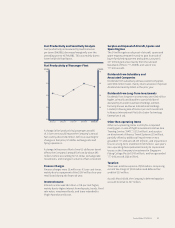
Aircra maintenance and overhaul costs increased $95 million (14.5 per cent) mainly due to more scheduled checks,
and higher component costs.
Sta costs rose $56 million (3.6 per cent), largely attributable to higher provision for profit sharing bonus from
better financial performance.
Other costs declined $64 million, mainly due to foreign exchange gain of $10 million against loss of $75 million last
year ($85 million).
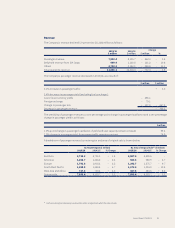
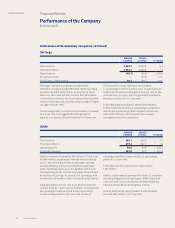
Expenditure
The Company’s expenditure declined 7.3 per cent to $11,201 million in 2015/16.
2015/16 2014/15 %
$ million % $ million % Change
Fuel costs 3,563.3 31.8 4,536.2 37.5 – 21.4
Staff costs 1,596.0 14.3 1,540.2 12.8 + 3.6
Depreciation R6 1,257.4 11.2 1,264.0 10.5 – 0.5
Handling charges 889.6 7.9 876.2 7.3 + 1.5
Aircraft maintenance and overhaul costs 750.9 6.7 655.7 5.4 + 14.5
Rentals on leased aircraft 702.6 6.3 698.3 5.8 + 0.6
Inflight meals and other passenger costs 669.9 6.0 676.7 5.6 – 1.0
Airport and overflying charges 584.4 5.2 594.8 4.9 – 1.7
Sales costs R7 561.7 5.0 552.9 4.6 + 1.6
Communication and information technology costs R8 91.1 0.8 85.0 0.7 + 7.2
Other costs R9 534.1 4.8 598.2 4.9 – 10.7
Total 11,201.0 100.0 12,078.2 100.0 – 7.3
A breakdown of fuel cost is shown below:
2015/16
$ million
2014/15
$ million
Change
$ million
Fuel cost (before hedging) 2,636.7 4,079.3 – 1,442.6
Fuel hedging loss 926.6 456.9 + 469.7
3,563.3 4,536.2 – 972.9
Expenditure on fuel before hedging was $1,442.6 million lower because of:
$ million
40.9% decrease in weighted average fuel price from 105.6 USD/BBL to 62.4 USD/BBL – 1,682.0
Strengthening of USD against SGD + 206.1
0.7% increase in volume uplifted from 30.4 million BBL to 30.6 million BBL + 33.3
– 1,442.6
Singapore Airlines54
PERFORMANCE