Singapore Airlines 2016 Annual Report Download - page 209
Download and view the complete annual report
Please find page 209 of the 2016 Singapore Airlines annual report below. You can navigate through the pages in the report by either clicking on the pages listed below, or by using the keyword search tool below to find specific information within the annual report.-
 1
1 -
2
-
3
-
4
-
5
-
6
-
7
-
8
-
9
-
10
-
11
-
12
-
13
-
14
-
15
-
16
-
17
-
18
-
19
-
20
-
21
-
22
-
23
-
24
-
25
-
26
-
27
-
28
-
29
-
30
-
31
-
32
-
33
-
34
-
35
-
36
-
37
-
38
-
39
-
40
-
41
-
42
-
43
-
44
-
45
-
46
-
47
-
48
-
49
-
50
-
51
-
52
-
53
-
54
-
55
-
56
-
57
-
58
-
59
-
60
-
61
-
62
-
63
-
64
-
65
-
66
-
67
-
68
-
69
-
70
-
71
-
72
-
73
-
74
-
75
-
76
-
77
-
78
-
79
-
80
-
81
-
82
-
83
-
84
-
85
-
86
-
87
-
88
-
89
-
90
-
91
-
92
-
93
-
94
-
95
-
96
-
97
-
98
-
99
-
100
-
101
-
102
-
103
-
104
-
105
-
106
-
107
-
108
-
109
-
110
-
111
-
112
-
113
-
114
-
115
-
116
-
117
-
118
-
119
-
120
-
121
-
122
-
123
-
124
-
125
-
126
-
127
-
128
-
129
-
130
-
131
-
132
-
133
-
134
-
135
-
136
-
137
-
138
-
139
-
140
-
141
-
142
-
143
-
144
-
145
-
146
-
147
-
148
-
149
-
150
-
151
-
152
-
153
-
154
-
155
-
156
-
157
-
158
-
159
-
160
-
161
-
162
-
163
-
164
-
165
-
166
-
167
-
168
-
169
-
170
-
171
-
172
-
173
-
174
-
175
-
176
-
177
-
178
-
179
-
180
-
181
-
182
-
183
-
184
-
185
-
186
-
187
-
188
-
189
-
190
-
191
-
192
-
193
-
194
-
195
-
196
-
197
-
198
-
 199
199 -
 200
200 -
 201
201 -
 202
202 -
 203
203 -
 204
204 -
 205
205 -
 206
206 -
 207
207 -
 208
208 -
 209
209 -
 210
210 -
 211
211 -
 212
212 -
 213
213 -
 214
214 -
 215
215 -
 216
216 -
 217
217 -
 218
218 -
 219
219 -
220
-
221
-
222
-
223
-
224
-
225
-
226
-
227
-
228
-
229
-
230
-
231
-
232
 |
 |

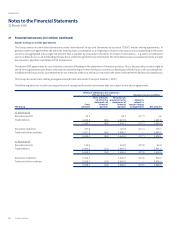
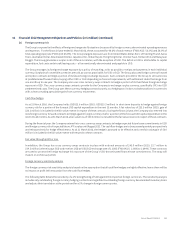
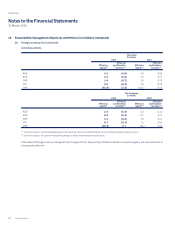
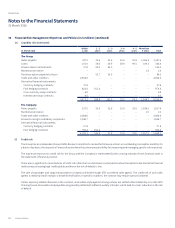
38 Financial Risk Management Objectives and Policies (in $ million) (continued)
(f) Credit risk (continued)
For all other service relationships, depending on the nature and scope of the services rendered, collateral is required, credit reports or
references are obtained and use is made of historical data from previous business relations, especially with regard to payment behaviour,
in order to avoid non-performance.
Collaterals requested from debtors include bank guarantees, cash-in-lieu of deposit and security deposits.
Allowance is made for doubtful accounts whenever risks are identified.
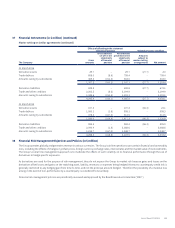
(g) Counterparty risk
Counterparty risk is the potential financial loss from a transaction that may arise in the event of default by the counterparty. Counterparty
risks are managed by limiting aggregated exposure on all outstanding financial instruments to any individual counterparty, taking into
account its credit rating. Such counterparty exposures are regularly reviewed, and adjusted as necessary. This mitigates the risk of material
loss arising from the event of non-performance by counterparties.
Surplus funds are invested in interest-bearing bank deposits and other high quality short-term liquid investments.
The Group determines concentrations of credit risk by monitoring the industry, country and credit rating of its counterparties. The table
below shows an analysis of credit risk exposures of balances that exceed 5% of the financial assets of the Group and the Company as at
31 March:
The Group The Company
Outstanding
balance
Percentage of total
financial assets
Outstanding
balance
Percentage of total
financial assets
2016 2015 2016 2015 2016 2015 2016 2015
Counterparty profiles
By industry:
Travel agencies 434.5 468.7 5.7% 5.5% 230.8 249.7 3.6% 3.4%
Airlines 160.3 250.9 2.1% 3.0% 125.3 66.5 1.9% 0.9%
Financial institutions 4,900.7 5,876.0 64.3% 69.2% 4,108.3 5,182.0 64.8% 70.1%
Others 1,636.7 1,440.0 21.5% 17.0% 1,647.2 1,265.8 26.0% 17.1%
7,132.2 8,035.6 93.6% 94.7% 6,111.6 6,764.0 96.3% 91.5%
By region:
East Asia 3,977.4 4,995.1 52.2% 58.8% 3,495.0 4,139.8 55.1% 55.9%
Europe 1,887.0 1,228.4 24.8% 14.5% 1,545.5 972.8 24.4% 13.2%
South West Pacific 927.5 1,288.5 12.2% 15.2% 864.1 1,233.6 13.6% 16.7%
Americas 276.3 433.9 3.6% 5.1% 169.0 352.3 2.7% 4.8%
West Asia and Africa 64.0 89.7 0.8% 1.1% 38.0 65.5 0.5% 0.9%
7,132.2 8,035.6 93.6% 94.7% 6,111.6 6,764.0 96.3% 91.5%
By Moody's credit ratings:
Investment grade (A to Aaa) 5,464.2 6,101.0 71.7% 71.9% 4,666.7 5,435.7 73.6% 73.6%
Investment grade (Baa) 8.8 2.2 0.1% 0.0% 1.3 0.9 0.0% 0.0%
Non-rated 1,659.2 1,932.4 21.8% 22.8% 1,443.6 1,327.4 22.7% 17.9%
7,132.2 8,035.6 93.6% 94.7% 6,111.6 6,764.0 96.3% 91.5%
Annual Report FY2015/16 207