Singapore Airlines 2016 Annual Report Download - page 49
Download and view the complete annual report
Please find page 49 of the 2016 Singapore Airlines annual report below. You can navigate through the pages in the report by either clicking on the pages listed below, or by using the keyword search tool below to find specific information within the annual report.-
 1
1 -
2
-
3
-
4
-
5
-
6
-
7
-
8
-
9
-
10
-
11
-
12
-
13
-
14
-
15
-
16
-
17
-
18
-
19
-
20
-
21
-
22
-
23
-
24
-
25
-
26
-
27
-
28
-
29
-
30
-
31
-
32
-
33
-
34
-
35
-
36
-
37
-
38
-
 39
39 -
 40
40 -
 41
41 -
 42
42 -
 43
43 -
 44
44 -
 45
45 -
 46
46 -
 47
47 -
 48
48 -
 49
49 -
 50
50 -
 51
51 -
 52
52 -
 53
53 -
 54
54 -
 55
55 -
 56
56 -
 57
57 -
 58
58 -
 59
59 -
60
-
61
-
62
-
63
-
64
-
65
-
66
-
67
-
68
-
69
-
70
-
71
-
72
-
73
-
74
-
75
-
76
-
77
-
78
-
79
-
80
-
81
-
82
-
83
-
84
-
85
-
86
-
87
-
88
-
89
-
90
-
91
-
92
-
93
-
94
-
95
-
96
-
97
-
98
-
99
-
100
-
101
-
102
-
103
-
104
-
105
-
106
-
107
-
108
-
109
-
110
-
111
-
112
-
113
-
114
-
115
-
116
-
117
-
118
-
119
-
120
-
121
-
122
-
123
-
124
-
125
-
126
-
127
-
128
-
129
-
130
-
131
-
132
-
133
-
134
-
135
-
136
-
137
-
138
-
139
-
140
-
141
-
142
-
143
-
144
-
145
-
146
-
147
-
148
-
149
-
150
-
151
-
152
-
153
-
154
-
155
-
156
-
157
-
158
-
159
-
160
-
161
-
162
-
163
-
164
-
165
-
166
-
167
-
168
-
169
-
170
-
171
-
172
-
173
-
174
-
175
-
176
-
177
-
178
-
179
-
180
-
181
-
182
-
183
-
184
-
185
-
186
-
187
-
188
-
189
-
190
-
191
-
192
-
193
-
194
-
195
-
196
-
197
-
198
-
199
-
200
-
201
-
202
-
203
-
204
-
205
-
206
-
207
-
208
-
209
-
210
-
211
-
212
-
213
-
214
-
215
-
216
-
217
-
218
-
219
-
220
-
221
-
222
-
223
-
224
-
225
-
226
-
227
-
228
-
229
-
230
-
231
-
232
 |
 |

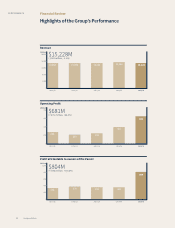
Total Assets ($ Million) NAV Per Share ($)
Equity Holders' Funds ($ Million)
Group Equity Holders' Funds, Total Assets and
Net Asset Value (NAV) per Share
30,000
25,000
20,000
15,000
10,000
5,000
0
14
12
10
8
6
4
2
0
Dollars$ Million
2012 2013 2014 2015 2016
Group Net Liquid Assets
5,000
4,000
3,000
2,000
1,000
0
5,000
4,000
3,000
2,000
1,000
0
$ Million $ Million
2012 2013 2014 2015 2016
Net Liquid Assets ($ Million)
R2 Net liquid assets is defined as the sum of cash and bank balances, and short-term investments, net of finance lease commitments, loans and
bonds issued.
As at 31 March 2016, equity attributable to owners of
the Parent increased by $291 million or 2.3 per cent to
$12,755 million, largely due to profit for the financial
year (+$804 million), and fair value movements on
cash flow hedges (+$121 million) and available-for-sale
financial assets (+$109 million). These were partially
oset by acquisition of a non-controlling interest in Tiger
Airways (-$335 million), payment of dividends (-$315
million) and purchase of treasury shares (-$85 million).
The fair value change on cash flow hedges was primarily
attributable to fair value changes on fuel hedges, while
the movement on available-for-sale financial assets
was mainly due to a fair value adjustment for SIA
Engineering Company Limited’s (“SIAEC”) interest in
Hong Kong Aero Engine Services Ltd (“HAESL”) arising
from the proposed divestment of its 10 per cent stake
in HAESL to Rolls-Royce Overseas Holdings Limited and
Hong Kong Aircra Engineering Company Limited. The
completion of this transaction is conditional upon the
approval of relevant national competition authorities.
Total Group assets decreased by $152 million or 0.6
per cent to $23,770 million as at 31 March 2016, mainly
attributable to a decrease in cash balances (-$1,070
million) and trade debtors (-$270 million), partially
oset by increase in property, plant and equipment
(+$620 million), investments (+$345 million) and a loan
to an associated company (+$62 million). The decrease
in cash balances largely arose from capital expenditure
(-$2,909 million), additional investment in Tiger
Airways in the Voluntary General Oer (-$458 million),
redemption of the five-year retail bonds (-$300 million),
and payment of dividends (-$315 million), partially
funded by operational cash inflows (+$3,005 million).
Net asset value per share increased 2.8 per cent to $10.96.
Total Group liabilities decreased by $355 million or 3.2 per
cent to $10,637 million as at 31 March 2016. The decrease
was attributable to the repayment of the retail bonds
(-$300 million) and reduction in derivative liabilities
(-$292 million), partially oset by an increase in sales in
advance of carriage (+$162 million), deferred account
(+$84 million) and deferred taxation (+$82 million).
The Group’s net liquid assetsR2 decreased by $179 million
to $3,293 million as at 31 March 2016, attributable to a
reduction in cash and bank balances (-$1,070 million),
partially oset by higher short-term investments
(+$499 million), and reduction in total debt (+$392
million) arising primarily from the redemption of the
$300 million retail bonds. Total debt to equity ratio
decreased by 0.03 times to 0.11 times as at 31 March 2016.
Financial Position
Annual Report FY2015/16 47