Singapore Airlines 2016 Annual Report Download - page 61
Download and view the complete annual report
Please find page 61 of the 2016 Singapore Airlines annual report below. You can navigate through the pages in the report by either clicking on the pages listed below, or by using the keyword search tool below to find specific information within the annual report.-
 1
1 -
2
-
3
-
4
-
5
-
6
-
7
-
8
-
9
-
10
-
11
-
12
-
13
-
14
-
15
-
16
-
17
-
18
-
19
-
20
-
21
-
22
-
23
-
24
-
25
-
26
-
27
-
28
-
29
-
30
-
31
-
32
-
33
-
34
-
35
-
36
-
37
-
38
-
39
-
40
-
41
-
42
-
43
-
44
-
45
-
46
-
47
-
48
-
49
-
50
-
 51
51 -
 52
52 -
 53
53 -
 54
54 -
 55
55 -
 56
56 -
 57
57 -
 58
58 -
 59
59 -
 60
60 -
 61
61 -
 62
62 -
 63
63 -
 64
64 -
 65
65 -
 66
66 -
 67
67 -
 68
68 -
 69
69 -
 70
70 -
 71
71 -
72
-
73
-
74
-
75
-
76
-
77
-
78
-
79
-
80
-
81
-
82
-
83
-
84
-
85
-
86
-
87
-
88
-
89
-
90
-
91
-
92
-
93
-
94
-
95
-
96
-
97
-
98
-
99
-
100
-
101
-
102
-
103
-
104
-
105
-
106
-
107
-
108
-
109
-
110
-
111
-
112
-
113
-
114
-
115
-
116
-
117
-
118
-
119
-
120
-
121
-
122
-
123
-
124
-
125
-
126
-
127
-
128
-
129
-
130
-
131
-
132
-
133
-
134
-
135
-
136
-
137
-
138
-
139
-
140
-
141
-
142
-
143
-
144
-
145
-
146
-
147
-
148
-
149
-
150
-
151
-
152
-
153
-
154
-
155
-
156
-
157
-
158
-
159
-
160
-
161
-
162
-
163
-
164
-
165
-
166
-
167
-
168
-
169
-
170
-
171
-
172
-
173
-
174
-
175
-
176
-
177
-
178
-
179
-
180
-
181
-
182
-
183
-
184
-
185
-
186
-
187
-
188
-
189
-
190
-
191
-
192
-
193
-
194
-
195
-
196
-
197
-
198
-
199
-
200
-
201
-
202
-
203
-
204
-
205
-
206
-
207
-
208
-
209
-
210
-
211
-
212
-
213
-
214
-
215
-
216
-
217
-
218
-
219
-
220
-
221
-
222
-
223
-
224
-
225
-
226
-
227
-
228
-
229
-
230
-
231
-
232
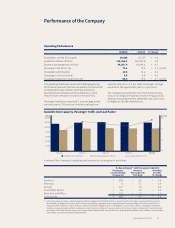
 |
 |

R11 Operating results dier from Tiger Airways’ FY2015/16 announcement on 5 May 2016, due to alignment of Tiger Airways’ classification to the Group.
R12 The results presented here represent Tiger Airways’ FY2014/15 results. Tiger Airways was consolidated as a subsidiary from October 2014.
Tiger Airways broke even for the 2015/16 financial year,
compared to a net loss of $264 million in the prior year.
Operating profit for the financial year was $14 million,
contrasting with a full year loss of $40 million incurred in
the prior year (+$54 million).
Revenue improvement of $26 million (+3.8 per cent) was
driven by higher yields (+2.9 per cent), partially oset
by lower passenger carriage (-1.5 per cent). Expenses
decreased by $28 million (-3.9 per cent) mainly due to
lower fuel costs, partially oset by an increase in aircra
depreciation, lease rentals and maintenance costs.
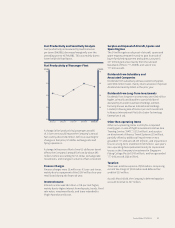
Yield improved by 2.9 per cent to 7.0¢/pkm. Unit cost
decreased by 3.3 per cent to 5.8 ¢/ask. Consequently,
breakeven load factor declined by 5.3 percentage
points to 82.9 per cent. Achieved load factor improved
by 1.2 percentage points to 83.3 per cent.
Tiger Airways operated flights to 40 destinations in
12 countries across Asia. During the year, Tiger Airways
introduced three new destinations – Ipoh (Malaysia),
Quanzhou (China) and Lucknow (India), in addition to
the re-instatement of services to Lijiang (China). Non-
performing route, Guilin (China), was suspended from
its network.
As at 31 March 2016, equity holders’ funds of Tiger
Airways stood at $217 million (+0.9 per cent).
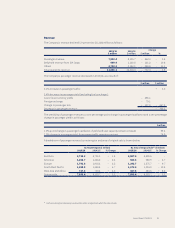
Tiger Airways
2015/16R11
$ million
2014/15R12
$ million % Change
Total revenue 703.2 677.4 + 3.8
Total expenditure 689.6 717.3 – 3.9
Operating profit/(loss) 13.6 (39.9) n.m.
Profit/(Loss) after taxation 0.3 (264.2) n.m.
Scoot’s revenue increased by $119 million (+30.1 per
cent) to $516 million, largely from an improvement in
passenger carriage (+29.1 per cent) on the back of a
25.7 per cent growth in capacity. Expenditure increased
$24 million (+5.1 per cent), benefitting from lower fuel
prices and a more fuel-eicient 787 fleet. As a result,
the operating loss in the prior year was reversed, and it
achieved an operating profit of $28 million this financial
year (+$95 million).
Yield was flat against last year, while unit cost fell
significantly by 19.0 per cent to 4.7¢/ask. Consequently,
breakeven load factor declined by 19.7 percentage points
to 83.9 per cent. Achieved load factor improved by 2.3
percentage points to 84.5 per cent.
Scoot registered a profit aer taxation of $21 million,
an improvement of $76 million from the $55 million
loss last year.
Scoot’s route network spanned 18 cities in seven
countries, including Singapore. During the year, Scoot
ceased operating the unprofitable triangular Singapore-
Sydney-Gold Coast route and introduced five new routes,
to Melbourne (Australia), Hangzhou (China), Guangzhou
(China), Kaohsiung (Taiwan)-Osaka (Japan), and
Bangkok (Thailand)-Osaka (Japan).
As at 31 March 2016, equity holders’ funds of Scoot stood
at $542 million (+4.8 per cent).
Performance of the Subsidiary Companies (continued)
Scoot
2015/16
$ million
2014/15
$ million % Change
Total revenue 516.2 396.7 + 30.1
Total expenditure 487.8 464.1 + 5.1
Operating profit/(loss) 28.4 (67.4) n.m.
Profit/(Loss) after taxation 21.1 (55.3) n.m.
Annual Report FY2015/16 59