Singapore Airlines 2016 Annual Report Download - page 145
Download and view the complete annual report
Please find page 145 of the 2016 Singapore Airlines annual report below. You can navigate through the pages in the report by either clicking on the pages listed below, or by using the keyword search tool below to find specific information within the annual report.-
 1
1 -
2
-
3
-
4
-
5
-
6
-
7
-
8
-
9
-
10
-
11
-
12
-
13
-
14
-
15
-
16
-
17
-
18
-
19
-
20
-
21
-
22
-
23
-
24
-
25
-
26
-
27
-
28
-
29
-
30
-
31
-
32
-
33
-
34
-
35
-
36
-
37
-
38
-
39
-
40
-
41
-
42
-
43
-
44
-
45
-
46
-
47
-
48
-
49
-
50
-
51
-
52
-
53
-
54
-
55
-
56
-
57
-
58
-
59
-
60
-
61
-
62
-
63
-
64
-
65
-
66
-
67
-
68
-
69
-
70
-
71
-
72
-
73
-
74
-
75
-
76
-
77
-
78
-
79
-
80
-
81
-
82
-
83
-
84
-
85
-
86
-
87
-
88
-
89
-
90
-
91
-
92
-
93
-
94
-
95
-
96
-
97
-
98
-
99
-
100
-
101
-
102
-
103
-
104
-
105
-
106
-
107
-
108
-
109
-
110
-
111
-
112
-
113
-
114
-
115
-
116
-
117
-
118
-
119
-
120
-
121
-
122
-
123
-
124
-
125
-
126
-
127
-
128
-
129
-
130
-
131
-
132
-
133
-
134
-
 135
135 -
 136
136 -
 137
137 -
 138
138 -
 139
139 -
 140
140 -
 141
141 -
 142
142 -
 143
143 -
 144
144 -
 145
145 -
 146
146 -
 147
147 -
 148
148 -
 149
149 -
 150
150 -
 151
151 -
 152
152 -
 153
153 -
 154
154 -
 155
155 -
156
-
157
-
158
-
159
-
160
-
161
-
162
-
163
-
164
-
165
-
166
-
167
-
168
-
169
-
170
-
171
-
172
-
173
-
174
-
175
-
176
-
177
-
178
-
179
-
180
-
181
-
182
-
183
-
184
-
185
-
186
-
187
-
188
-
189
-
190
-
191
-
192
-
193
-
194
-
195
-
196
-
197
-
198
-
199
-
200
-
201
-
202
-
203
-
204
-
205
-
206
-
207
-
208
-
209
-
210
-
211
-
212
-
213
-
214
-
215
-
216
-
217
-
218
-
219
-
220
-
221
-
222
-
223
-
224
-
225
-
226
-
227
-
228
-
229
-
230
-
231
-
232
 |
 |

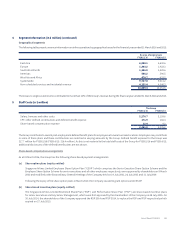
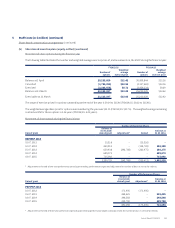
5 Sta Costs (in $ million) (continued)
Share-based compensation arrangements (continued)
(b) Share-based incentive plans (equity-settled) (continued)
Movement of share options during the financial year
The following table illustrates the number and weighted average exercise prices of, and movements in, the ESOP during the financial year:
FY2015/16 FY2014/15
Number of
options
Weighted
average
exercise price
Number of
options
Weighted
average
exercise price
Balance at 1 April 25,233,029 $12.42 30,809,844 $12.16
Cancelled (1,754,354) $10.52 (2,117,481) $12.06
Exercised (2,365,478) $8.71 (3,459,334) $8.29
Balance at 31 March 21,113,197 $13.03 25,233,029 $12.42
Exercisable at 31 March 21,113,197 $13.03 25,233,029 $12.42
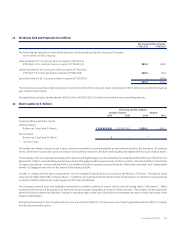
The range of exercise prices for options outstanding at the end of the year is $9.34 to $15.46 (FY2014/15: $8.02 to $15.46).
The weighted average share price for options exercised during the year was $11.01 (FY2014/15: $10.76). The weighted average remaining
contractual life for these options is 1.46 years (FY2014/15: 2.21 years).
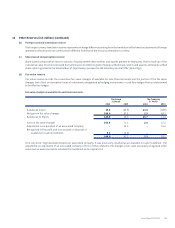
Movement of share awards during the financial year
Number of Restricted Shares
Date of grant
Balance at
01.04.2015/
date of grant Adjustment* Vested
Balance at
31.03.2016
RSP/RSP 2014
01.07.2011 15,216 – (15,216) –
10.07.2012 220,910 – (118,722) 102,188
15.07.2013 650,438 (242,788) (221,475) 186,175
03.07.2014 689,073 – – 689,073
03.07.2015 715,092 – – 715,092
2,290,729 (242,788) (355,413) 1,692,528
* Adjustment at the end of two-year performance period upon meeting performance targets and adjustment for number of days in service for retirees.
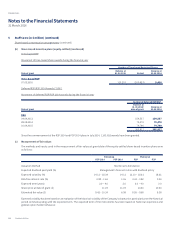
Number of Performance Shares
Date of grant
Balance at
01.04.2015/
date of grant Adjustment#
Balance at
31.03.2016
PSP/PSP 2014
10.07.2012 173,405 (173,405) –
15.07.2013 228,425 – 228,425
03.07.2014 248,568 – 248,568
03.07.2015 239,700 – 239,700
890,098 (173,405) 716,693
# Adjustment at the end of three-year performance period upon meeting performance targets and adjustment for number of days in service for retirees.
Annual Report FY2015/16 143