Singapore Airlines 2016 Annual Report Download - page 200
Download and view the complete annual report
Please find page 200 of the 2016 Singapore Airlines annual report below. You can navigate through the pages in the report by either clicking on the pages listed below, or by using the keyword search tool below to find specific information within the annual report.-
 1
1 -
2
-
3
-
4
-
5
-
6
-
7
-
8
-
9
-
10
-
11
-
12
-
13
-
14
-
15
-
16
-
17
-
18
-
19
-
20
-
21
-
22
-
23
-
24
-
25
-
26
-
27
-
28
-
29
-
30
-
31
-
32
-
33
-
34
-
35
-
36
-
37
-
38
-
39
-
40
-
41
-
42
-
43
-
44
-
45
-
46
-
47
-
48
-
49
-
50
-
51
-
52
-
53
-
54
-
55
-
56
-
57
-
58
-
59
-
60
-
61
-
62
-
63
-
64
-
65
-
66
-
67
-
68
-
69
-
70
-
71
-
72
-
73
-
74
-
75
-
76
-
77
-
78
-
79
-
80
-
81
-
82
-
83
-
84
-
85
-
86
-
87
-
88
-
89
-
90
-
91
-
92
-
93
-
94
-
95
-
96
-
97
-
98
-
99
-
100
-
101
-
102
-
103
-
104
-
105
-
106
-
107
-
108
-
109
-
110
-
111
-
112
-
113
-
114
-
115
-
116
-
117
-
118
-
119
-
120
-
121
-
122
-
123
-
124
-
125
-
126
-
127
-
128
-
129
-
130
-
131
-
132
-
133
-
134
-
135
-
136
-
137
-
138
-
139
-
140
-
141
-
142
-
143
-
144
-
145
-
146
-
147
-
148
-
149
-
150
-
151
-
152
-
153
-
154
-
155
-
156
-
157
-
158
-
159
-
160
-
161
-
162
-
163
-
164
-
165
-
166
-
167
-
168
-
169
-
170
-
171
-
172
-
173
-
174
-
175
-
176
-
177
-
178
-
179
-
180
-
181
-
182
-
183
-
184
-
185
-
186
-
187
-
188
-
189
-
 190
190 -
 191
191 -
 192
192 -
 193
193 -
 194
194 -
 195
195 -
 196
196 -
 197
197 -
 198
198 -
 199
199 -
 200
200 -
 201
201 -
 202
202 -
 203
203 -
 204
204 -
 205
205 -
 206
206 -
 207
207 -
 208
208 -
 209
209 -
 210
210 -
211
-
212
-
213
-
214
-
215
-
216
-
217
-
218
-
219
-
220
-
221
-
222
-
223
-
224
-
225
-
226
-
227
-
228
-
229
-
230
-
231
-
232
 |
 |

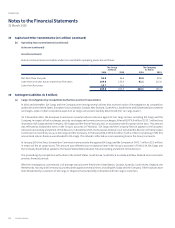
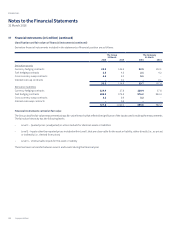
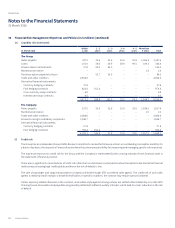
Notes to the Financial Statements
31 March 2016
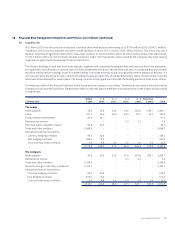
37 Financial Instruments (in $ million) (continued)
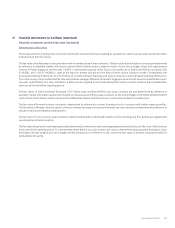
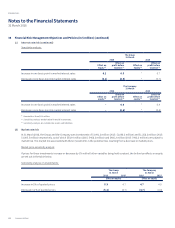
Master netting or similar agreements
The Group enters into derivative transactions under International Swaps and Derivatives Association (“ISDA”) master netting agreements. In
general, under such agreements the amounts owed by each counterparty on a single day in respect of all transactions outstanding in the same
currency are aggregated into a single net amount that is payable by one party to the other. In certain circumstances – e.g. when a credit event
such as a default occurs, all outstanding transactions under the agreement are terminated, the termination value is assessed and only a single
net amount is payable in settlement of all transactions.
The above ISDA agreements do not meet the criteria for osetting in the statement of financial position. This is because they create a right of
set-o of recognised amounts that is enforceable only following an event of default, insolvency or bankruptcy of the Group or the counterparties.
In addition the Group and its counterparties do not intend to settle on a net basis or to realise the assets and settle the liabilities simultaneously.
The Group also enters into netting arrangements with International Air Transport Aviation (“IATA”).
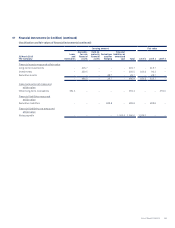
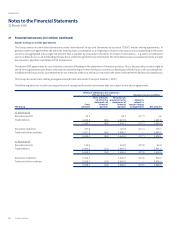
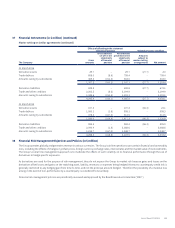
The following table sets out the carrying amounts of recognised financial instruments that are subject to the above agreements.
Effects of offsetting in the statements
of financial position Related amounts not offset
The Group
Gross
amounts
Gross amounts
set-off in the
statements of
financial
position
Net amounts
presented in the
statements of
financial
position
Amounts
subject to
master netting
arrangements Net amount
31 March 2016
Derivative assets 32.3 – 32.3 (27.7) 4.6
Trade debtors 1,230.4 (8.6) 1,221.8 – 1,221.8
1,262.7 (8.6) 1,254.1 (27.7) 1,226.4
Derivative liabilities 727.8 – 727.8 (27.7) 700.1
Trade and other creditors 2,907.6 (8.6) 2,899.0 – 2,899.0
3,635.4 (8.6) 3,626.8 (27.7) 3,599.1
31 March 2015
Derivative assets 114.8 – 114.8 (87.9) 26.9
Trade debtors 1,493.3 (1.8) 1,491.5 – 1,491.5
1,608.1 (1.8) 1,606.3 (87.9) 1,518.4
Derivative liabilities 1,020.0 – 1,020.0 (87.9) 932.1
Trade and other creditors 2,908.3 (1.8) 2,906.5 – 2,906.5
3,928.3 (1.8) 3,926.5 (87.9) 3,838.6
Singapore Airlines198
FINANCIAL