Singapore Airlines 2016 Annual Report Download - page 50
Download and view the complete annual report
Please find page 50 of the 2016 Singapore Airlines annual report below. You can navigate through the pages in the report by either clicking on the pages listed below, or by using the keyword search tool below to find specific information within the annual report.-
 1
1 -
2
-
3
-
4
-
5
-
6
-
7
-
8
-
9
-
10
-
11
-
12
-
13
-
14
-
15
-
16
-
17
-
18
-
19
-
20
-
21
-
22
-
23
-
24
-
25
-
26
-
27
-
28
-
29
-
30
-
31
-
32
-
33
-
34
-
35
-
36
-
37
-
38
-
39
-
 40
40 -
 41
41 -
 42
42 -
 43
43 -
 44
44 -
 45
45 -
 46
46 -
 47
47 -
 48
48 -
 49
49 -
 50
50 -
 51
51 -
 52
52 -
 53
53 -
 54
54 -
 55
55 -
 56
56 -
 57
57 -
 58
58 -
 59
59 -
 60
60 -
61
-
62
-
63
-
64
-
65
-
66
-
67
-
68
-
69
-
70
-
71
-
72
-
73
-
74
-
75
-
76
-
77
-
78
-
79
-
80
-
81
-
82
-
83
-
84
-
85
-
86
-
87
-
88
-
89
-
90
-
91
-
92
-
93
-
94
-
95
-
96
-
97
-
98
-
99
-
100
-
101
-
102
-
103
-
104
-
105
-
106
-
107
-
108
-
109
-
110
-
111
-
112
-
113
-
114
-
115
-
116
-
117
-
118
-
119
-
120
-
121
-
122
-
123
-
124
-
125
-
126
-
127
-
128
-
129
-
130
-
131
-
132
-
133
-
134
-
135
-
136
-
137
-
138
-
139
-
140
-
141
-
142
-
143
-
144
-
145
-
146
-
147
-
148
-
149
-
150
-
151
-
152
-
153
-
154
-
155
-
156
-
157
-
158
-
159
-
160
-
161
-
162
-
163
-
164
-
165
-
166
-
167
-
168
-
169
-
170
-
171
-
172
-
173
-
174
-
175
-
176
-
177
-
178
-
179
-
180
-
181
-
182
-
183
-
184
-
185
-
186
-
187
-
188
-
189
-
190
-
191
-
192
-
193
-
194
-
195
-
196
-
197
-
198
-
199
-
200
-
201
-
202
-
203
-
204
-
205
-
206
-
207
-
208
-
209
-
210
-
211
-
212
-
213
-
214
-
215
-
216
-
217
-
218
-
219
-
220
-
221
-
222
-
223
-
224
-
225
-
226
-
227
-
228
-
229
-
230
-
231
-
232
 |
 |
Financial Review
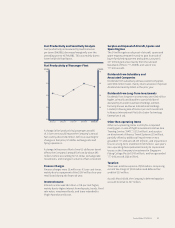
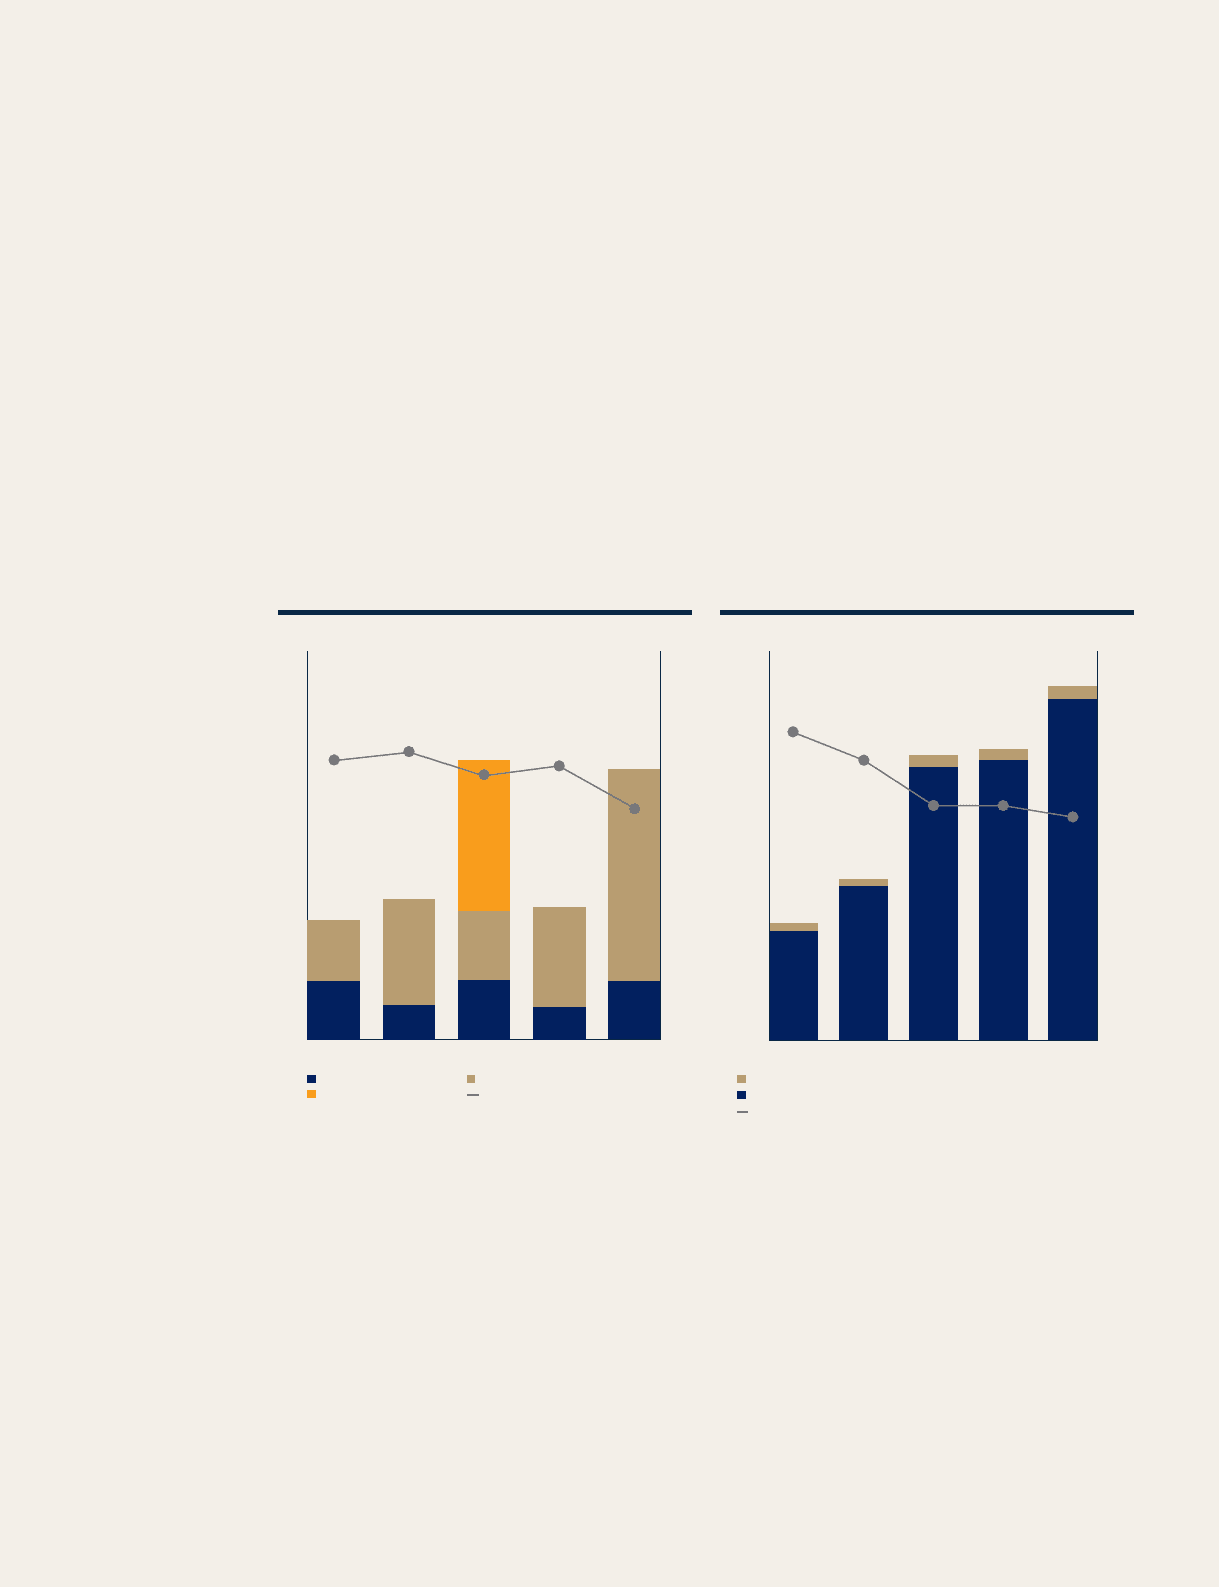
Group Capital Expenditure
Times$ Million
3,000
2,500
2,000
1,500
1,000
2
1
0
2011/12 2012/13 2013/14 2014/15 2015/16
Other Capital Expenditure ($ Million)
Capital Expenditure on Aircra, Spares and Spare Engines ($ Million)
Cash Flow: Capital Expenditure Ratio (Times)
Performance of the Group
(continued)
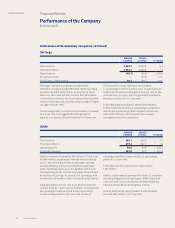
Dividend Payout
Per CentCents
60
40
20
0
80
70
60
50
40
2011/12 2012/13 2013/14 2014/15 2015/16
Final Dividend (¢)
Special Dividend (¢) Ordinary Dividend Payout Ratio (%)
Interim Dividend (¢)
Dividends
For the financial year ended 31 March 2016, the Board
recommends a final dividend of 35 cents per share.
Including the interim dividend of 10 cents per share paid
on 27 November 2015, the total dividend for the 2015/16
financial year will be 45 cents per share. This amounts
to a payout of approximately $524 million based on
the number of issued shares as at 31 March 2016. The
total ordinary dividend per share of 45 cents translates
to a payout ratio of 65.1 per cent, a decrease of 4.9
percentage points compared to the 2014/15 payout ratio
of 70.0 per cent.
Capital Expenditure and Cash Flow of the Group
Capital expenditure was $2,909 million, 11.9 per cent
higher than last year. About 98 per cent of the capital
spending was on aircra, spares and spare engines.
Internally generated cash flow of $3,501 million
(+5.9 per cent) was 1.2 times of capital expenditure.
The increase in internally generated cash flow
was mainly attributable to higher cash flow from
operations, partially oset by lower proceeds from
disposal of aircra, spares and spare engines, and
dividends received from associated and joint venture
companies.
Singapore Airlines48
PERFORMANCE