Singapore Airlines 2016 Annual Report Download - page 167
Download and view the complete annual report
Please find page 167 of the 2016 Singapore Airlines annual report below. You can navigate through the pages in the report by either clicking on the pages listed below, or by using the keyword search tool below to find specific information within the annual report.-
 1
1 -
2
-
3
-
4
-
5
-
6
-
7
-
8
-
9
-
10
-
11
-
12
-
13
-
14
-
15
-
16
-
17
-
18
-
19
-
20
-
21
-
22
-
23
-
24
-
25
-
26
-
27
-
28
-
29
-
30
-
31
-
32
-
33
-
34
-
35
-
36
-
37
-
38
-
39
-
40
-
41
-
42
-
43
-
44
-
45
-
46
-
47
-
48
-
49
-
50
-
51
-
52
-
53
-
54
-
55
-
56
-
57
-
58
-
59
-
60
-
61
-
62
-
63
-
64
-
65
-
66
-
67
-
68
-
69
-
70
-
71
-
72
-
73
-
74
-
75
-
76
-
77
-
78
-
79
-
80
-
81
-
82
-
83
-
84
-
85
-
86
-
87
-
88
-
89
-
90
-
91
-
92
-
93
-
94
-
95
-
96
-
97
-
98
-
99
-
100
-
101
-
102
-
103
-
104
-
105
-
106
-
107
-
108
-
109
-
110
-
111
-
112
-
113
-
114
-
115
-
116
-
117
-
118
-
119
-
120
-
121
-
122
-
123
-
124
-
125
-
126
-
127
-
128
-
129
-
130
-
131
-
132
-
133
-
134
-
135
-
136
-
137
-
138
-
139
-
140
-
141
-
142
-
143
-
144
-
145
-
146
-
147
-
148
-
149
-
150
-
151
-
152
-
153
-
154
-
155
-
156
-
 157
157 -
 158
158 -
 159
159 -
 160
160 -
 161
161 -
 162
162 -
 163
163 -
 164
164 -
 165
165 -
 166
166 -
 167
167 -
 168
168 -
 169
169 -
 170
170 -
 171
171 -
 172
172 -
 173
173 -
 174
174 -
 175
175 -
 176
176 -
 177
177 -
178
-
179
-
180
-
181
-
182
-
183
-
184
-
185
-
186
-
187
-
188
-
189
-
190
-
191
-
192
-
193
-
194
-
195
-
196
-
197
-
198
-
199
-
200
-
201
-
202
-
203
-
204
-
205
-
206
-
207
-
208
-
209
-
210
-
211
-
212
-
213
-
214
-
215
-
216
-
217
-
218
-
219
-
220
-
221
-
222
-
223
-
224
-
225
-
226
-
227
-
228
-
229
-
230
-
231
-
232
 |
 |

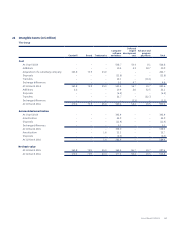
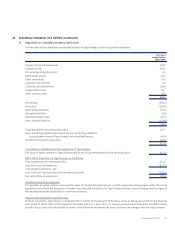
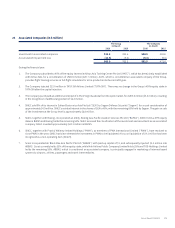
22 Intangible Assets (in $ million)
The Group
Goodwill Brand Trademarks
Computer
software
and others
Deferred
engine
development
cost
Advance and
progress
payments Total
Cost
At 1 April 2014 – – – 508.7 50.0 8.1 566.8
Additions – – – 10.2 2.0 18.7 30.9
Acquisition of a subsidiary company 163.8 75.9 25.0 – – – 264.7
Disposals – – – (11.6) – – (11.6)
Transfers – – – 16.1 – (16.1) –
Exchange differences – – – 0.1 4.7 – 4.8
At 31 March 2015 163.8 75.9 25.0 523.5 56.7 10.7 855.6
Additions 6.6 – – 10.4 2.6 32.5 52.1
Disposals – – – (6.4) – – (6.4)
Transfers – – – 32.7 – (32.7) –
Exchange differences – – – – (1.1) – (1.1)
At 31 March 2016 170.4 75.9 25.0 560.2 58.2 10.5 900.2
Accumulated amortisation
At 1 April 2014 – – – 343.4 – – 343.4
Amortisation – – – 25.9 – – 25.9
Disposals – – – (11.4) – – (11.4)
Exchange differences – – – 0.1 – – 0.1
At 31 March 2015 – – – 358.0 – – 358.0
Amortisation – – 1.6 31.1 – – 32.7
Disposals – – – (6.3) – – (6.3)
At 31 March 2016 – – 1.6 382.8 – – 384.4
Net book value
At 31 March 2015 163.8 75.9 25.0 165.5 56.7 10.7 497.6
At 31 March 2016 170.4 75.9 23.4 177.4 58.2 10.5 515.8
Annual Report FY2015/16 165