Singapore Airlines 2016 Annual Report Download - page 217
Download and view the complete annual report
Please find page 217 of the 2016 Singapore Airlines annual report below. You can navigate through the pages in the report by either clicking on the pages listed below, or by using the keyword search tool below to find specific information within the annual report.-
 1
1 -
2
-
3
-
4
-
5
-
6
-
7
-
8
-
9
-
10
-
11
-
12
-
13
-
14
-
15
-
16
-
17
-
18
-
19
-
20
-
21
-
22
-
23
-
24
-
25
-
26
-
27
-
28
-
29
-
30
-
31
-
32
-
33
-
34
-
35
-
36
-
37
-
38
-
39
-
40
-
41
-
42
-
43
-
44
-
45
-
46
-
47
-
48
-
49
-
50
-
51
-
52
-
53
-
54
-
55
-
56
-
57
-
58
-
59
-
60
-
61
-
62
-
63
-
64
-
65
-
66
-
67
-
68
-
69
-
70
-
71
-
72
-
73
-
74
-
75
-
76
-
77
-
78
-
79
-
80
-
81
-
82
-
83
-
84
-
85
-
86
-
87
-
88
-
89
-
90
-
91
-
92
-
93
-
94
-
95
-
96
-
97
-
98
-
99
-
100
-
101
-
102
-
103
-
104
-
105
-
106
-
107
-
108
-
109
-
110
-
111
-
112
-
113
-
114
-
115
-
116
-
117
-
118
-
119
-
120
-
121
-
122
-
123
-
124
-
125
-
126
-
127
-
128
-
129
-
130
-
131
-
132
-
133
-
134
-
135
-
136
-
137
-
138
-
139
-
140
-
141
-
142
-
143
-
144
-
145
-
146
-
147
-
148
-
149
-
150
-
151
-
152
-
153
-
154
-
155
-
156
-
157
-
158
-
159
-
160
-
161
-
162
-
163
-
164
-
165
-
166
-
167
-
168
-
169
-
170
-
171
-
172
-
173
-
174
-
175
-
176
-
177
-
178
-
179
-
180
-
181
-
182
-
183
-
184
-
185
-
186
-
187
-
188
-
189
-
190
-
191
-
192
-
193
-
194
-
195
-
196
-
197
-
198
-
199
-
200
-
201
-
202
-
203
-
204
-
205
-
206
-
 207
207 -
 208
208 -
 209
209 -
 210
210 -
 211
211 -
 212
212 -
 213
213 -
 214
214 -
 215
215 -
 216
216 -
 217
217 -
 218
218 -
 219
219 -
 220
220 -
 221
221 -
 222
222 -
 223
223 -
 224
224 -
 225
225 -
 226
226 -
 227
227 -
228
-
229
-
230
-
231
-
232
 |
 |

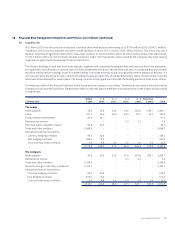
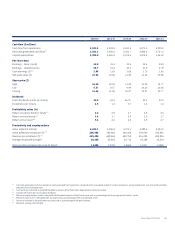
2015/16 2014/15 2013/14 2012/13 2011/12
Cash flow ($ million)
Cash flow from operations 2,929.8 2,193.9 2,241.6 2,071.1 2,099.0
Internally generated cash flow R1 3,501.3 3,306.0 3,221.7 2,859.0 2,727.2
Capital expenditure 2,909.0 2,600.2 2,574.6 1,875.4 1,641.2
Per share data
Earnings – basic (cents) 69.0 31.4 30.6 32.2 28.3
Earnings – diluted (cents) 68.7 31.2 30.3 31.9 27.9
Cash earnings ($) R2 2.06 1.65 1.68 1.70 1.65
Net asset value ($) 10.96 10.66 11.26 11.14 10.96
Share price ($)
High 12.24 12.91 11.45 11.35 14.77
Low 9.57 9.57 9.44 10.10 10.05
Closing 11.42 11.95 10.47 10.87 10.77
Dividends
Gross dividends (cents per share) 45.0 22.0 46.0R3 23.0 20.0
Dividend cover (times) 1.5 1.4 0.7 1.4 1.4
Profitability ratios (%)
Return on equity holders’ funds R4 6.4 2.9 2.7 2.9 2.5
Return on total assets R5 3.6 1.7 1.9 2.0 1.7
Return on turnover R6 5.6 2.6 2.8 2.9 2.7
Productivity and employee data
Value added ($ million) 5,040.1 4,396.8 4,370.1 4,499.6 4,344.3
Value added per employee ($) R7 206,986 183,483 184,268 194,040 192,960
Revenue per employee ($) R7 625,400 649,564 642,769 651,093 659,936
Average employee strength 24,350 23,963 23,716 23,189 22,514
SGD per USD exchange rate as at 31 March 1.3494 1.3752 1.2606 1.2417 1.2569
R1 Internally generated cash flow comprises cash generated from operations, dividends from associated and joint venture companies, and proceeds from sale of aircra and other
property, plant and equipment.
R2 Cash earnings is defined as profit attributable to owners of the Parent plus depreciation and amortisation.
R3 Includes 25.0 cents per share special dividend.
R4 Return on equity holders’ funds is the profit attributable to owners of the Parent expressed as a percentage of the average equity holders’ funds.
R5 Return on total assets is the profit aer tax expressed as a percentage of the average total assets.
R6 Return on turnover is the profit aer tax expressed as a percentage of the total revenue.
R7 Based on average sta strength.
Annual Report FY2015/16 215