Singapore Airlines 2016 Annual Report Download - page 137
Download and view the complete annual report
Please find page 137 of the 2016 Singapore Airlines annual report below. You can navigate through the pages in the report by either clicking on the pages listed below, or by using the keyword search tool below to find specific information within the annual report.-
 1
1 -
2
-
3
-
4
-
5
-
6
-
7
-
8
-
9
-
10
-
11
-
12
-
13
-
14
-
15
-
16
-
17
-
18
-
19
-
20
-
21
-
22
-
23
-
24
-
25
-
26
-
27
-
28
-
29
-
30
-
31
-
32
-
33
-
34
-
35
-
36
-
37
-
38
-
39
-
40
-
41
-
42
-
43
-
44
-
45
-
46
-
47
-
48
-
49
-
50
-
51
-
52
-
53
-
54
-
55
-
56
-
57
-
58
-
59
-
60
-
61
-
62
-
63
-
64
-
65
-
66
-
67
-
68
-
69
-
70
-
71
-
72
-
73
-
74
-
75
-
76
-
77
-
78
-
79
-
80
-
81
-
82
-
83
-
84
-
85
-
86
-
87
-
88
-
89
-
90
-
91
-
92
-
93
-
94
-
95
-
96
-
97
-
98
-
99
-
100
-
101
-
102
-
103
-
104
-
105
-
106
-
107
-
108
-
109
-
110
-
111
-
112
-
113
-
114
-
115
-
116
-
117
-
118
-
119
-
120
-
121
-
122
-
123
-
124
-
125
-
126
-
 127
127 -
 128
128 -
 129
129 -
 130
130 -
 131
131 -
 132
132 -
 133
133 -
 134
134 -
 135
135 -
 136
136 -
 137
137 -
 138
138 -
 139
139 -
 140
140 -
 141
141 -
 142
142 -
 143
143 -
 144
144 -
 145
145 -
 146
146 -
 147
147 -
148
-
149
-
150
-
151
-
152
-
153
-
154
-
155
-
156
-
157
-
158
-
159
-
160
-
161
-
162
-
163
-
164
-
165
-
166
-
167
-
168
-
169
-
170
-
171
-
172
-
173
-
174
-
175
-
176
-
177
-
178
-
179
-
180
-
181
-
182
-
183
-
184
-
185
-
186
-
187
-
188
-
189
-
190
-
191
-
192
-
193
-
194
-
195
-
196
-
197
-
198
-
199
-
200
-
201
-
202
-
203
-
204
-
205
-
206
-
207
-
208
-
209
-
210
-
211
-
212
-
213
-
214
-
215
-
216
-
217
-
218
-
219
-
220
-
221
-
222
-
223
-
224
-
225
-
226
-
227
-
228
-
229
-
230
-
231
-
232
 |
 |

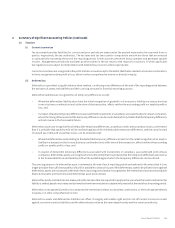
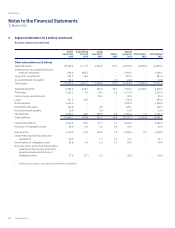
3 Significant Accounting Estimates and Critical Judgements
Estimates and assumptions concerning the future are made in the preparation of the financial statements. They aect the application of the
Group’s accounting policies, reported amounts of assets, liabilities, income and expenses, and disclosures made. Actual results may dier from
these estimates. They are assessed on an ongoing basis and are based on experience and relevant factors, including expectations of future
events that are believed to be reasonable under the circumstances. Revisions to accounting estimates are recognised in the period in which
the estimates are revised and in any future periods aected.
The key assumptions concerning the future and other key sources of estimation uncertainty at the end of the reporting period that have a
significant risk of causing a material adjustment to the carrying amounts of assets and liabilities within the next financial year are discussed below.
(a) Impairment of property, plant and equipment – aircra fleet
Impairment is recognised when events and circumstances indicate that the aircra may be impaired and the carrying amounts of the
aircra exceed the recoverable amounts. Recoverable amount is defined as the higher of an aircra’s fair value less costs to sell and its
value-in-use. The fair value less costs to sell computation is based on available data from binding sales transactions in an arm’s length
transaction of similar assets or observable market prices less incremental costs for disposing the asset. In determining the recoverable
amounts of the aircra, certain estimates regarding the current fair market value of the aircra are made. The current fair market value
is determined based on desktop valuations from an independent appraisal for fleet with similar operational lives. When value-in-use
calculations are undertaken, the Group uses discounted cash flow projections based on financial budgets approved by the Management
covering a specified period. For the purpose of impairment testing, assets that cannot be tested individually are grouped together into
the smallest group of assets that generates cash inflows from continuing use that are largely independent of the cash inflows of other
assets or CGU.
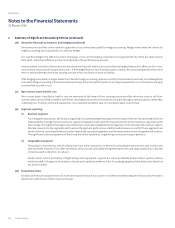
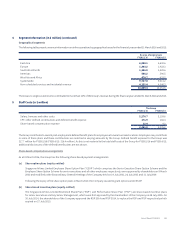
(b) Depreciation of property, plant and equipment – aircra fleet
Aircra are depreciated on a straight-line basis at rates which are calculated to write down their cost to their estimated residual values
at the end of their operational lives. Certain estimates regarding the operational lives and residual values of the fleet are made by the
Group based on past experience and these are in line with the industry’s. The operational lives and residual values are reviewed on
an annual basis. The carrying amount of the Group’s and the Company’s aircra fleet at 31 March 2016 was $10,106.2 million (2015:
$9,632.3 million) and $7,358.7 million (2015: $7,553.2 million) respectively.
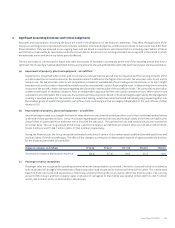
During the financial year, the Group revised the estimated useful lives of certain of its overhaul assets and the estimated useful lives and
residual values of certain aircra types. The eect of the changes is a reduction in depreciation expense of approximately $66.6 million
for the financial year ended 31 March 2016.
Change in estimates (in $ million) FY15/16 FY16/17 FY17/18 FY18/19 FY19/20
(Decrease)/Increase in depreciation expense (66.6) (57.9) 29.9 87.3 42.4
(c) Passenger revenue recognition
Passenger sales are recognised as operating revenue when the transportation is provided. The value of unused tickets is included as
sales in advance of carriage on the statement of financial position and recognised as revenue at the end of two years. This is estimated
based on historical trends and experiences of the Group whereby ticket upli occurs mainly within the first two years. The carrying
amount of the Group’s and the Company’s sales in advance of carriage at 31 March 2016 was $1,626.2 million (2015: $1,464.7 million)
and $1,460.1 million (2015: $1,328.6 million) respectively.
Annual Report FY2015/16 135