Singapore Airlines 2016 Annual Report Download - page 4
Download and view the complete annual report
Please find page 4 of the 2016 Singapore Airlines annual report below. You can navigate through the pages in the report by either clicking on the pages listed below, or by using the keyword search tool below to find specific information within the annual report.-
 1
1 -
 2
2 -
 3
3 -
 4
4 -
 5
5 -
 6
6 -
 7
7 -
 8
8 -
 9
9 -
 10
10 -
 11
11 -
 12
12 -
 13
13 -
 14
14 -
 15
15 -
16
-
17
-
18
-
19
-
20
-
21
-
22
-
23
-
24
-
25
-
26
-
27
-
28
-
29
-
30
-
31
-
32
-
33
-
34
-
35
-
36
-
37
-
38
-
39
-
40
-
41
-
42
-
43
-
44
-
45
-
46
-
47
-
48
-
49
-
50
-
51
-
52
-
53
-
54
-
55
-
56
-
57
-
58
-
59
-
60
-
61
-
62
-
63
-
64
-
65
-
66
-
67
-
68
-
69
-
70
-
71
-
72
-
73
-
74
-
75
-
76
-
77
-
78
-
79
-
80
-
81
-
82
-
83
-
84
-
85
-
86
-
87
-
88
-
89
-
90
-
91
-
92
-
93
-
94
-
95
-
96
-
97
-
98
-
99
-
100
-
101
-
102
-
103
-
104
-
105
-
106
-
107
-
108
-
109
-
110
-
111
-
112
-
113
-
114
-
115
-
116
-
117
-
118
-
119
-
120
-
121
-
122
-
123
-
124
-
125
-
126
-
127
-
128
-
129
-
130
-
131
-
132
-
133
-
134
-
135
-
136
-
137
-
138
-
139
-
140
-
141
-
142
-
143
-
144
-
145
-
146
-
147
-
148
-
149
-
150
-
151
-
152
-
153
-
154
-
155
-
156
-
157
-
158
-
159
-
160
-
161
-
162
-
163
-
164
-
165
-
166
-
167
-
168
-
169
-
170
-
171
-
172
-
173
-
174
-
175
-
176
-
177
-
178
-
179
-
180
-
181
-
182
-
183
-
184
-
185
-
186
-
187
-
188
-
189
-
190
-
191
-
192
-
193
-
194
-
195
-
196
-
197
-
198
-
199
-
200
-
201
-
202
-
203
-
204
-
205
-
206
-
207
-
208
-
209
-
210
-
211
-
212
-
213
-
214
-
215
-
216
-
217
-
218
-
219
-
220
-
221
-
222
-
223
-
224
-
225
-
226
-
227
-
228
-
229
-
230
-
231
-
232
 |
 |
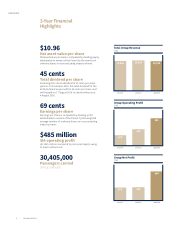
$10.96
Net asset value per share
Net asset value per share is computed by dividing equity
attributable to owners of the Parent by the number of
ordinary shares in issue excluding treasury shares.
45 cents
Total dividend per share
Including the interim dividend of 10 cents per share
paid on 27 November 2015, the total dividend for the
2015/16 financial year will be 45 cents per share, and
will be paid on 17 August 2016 to shareholders as at
4 August 2016.
69 cents
Earnings per share
Earnings per share is computed by dividing profit
attributable to owners of the Parent by the weighted
average number of ordinary shares in issue excluding
treasury shares.
$485 million
SIA operating profit
Up $145 million compared to prior year largely owing
to lower net fuel cost.
30,405,000
Passengers carried
(Group airlines)
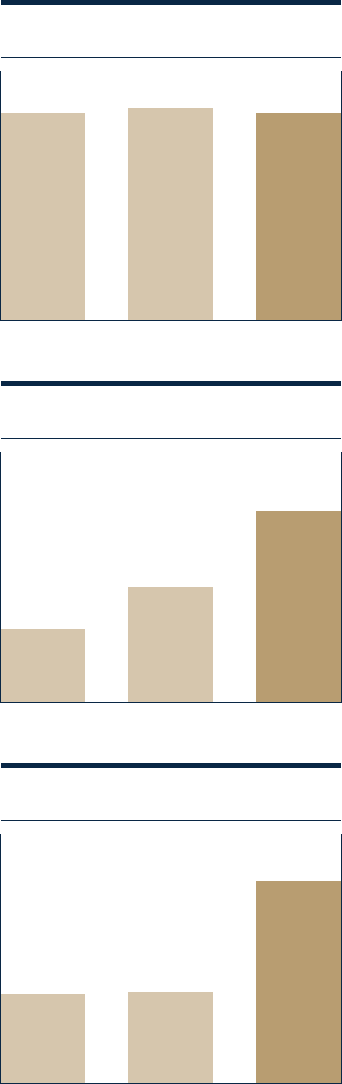
Total Group Revenue
($M)
2013/14 2014/15 2015/16
15,228
15,566
15,244
Group Operating Profit
($M)
2013/14 2014/15 2015/16
681
410
259
Group Net Profit
($M)
2013/14 2014/15 2015/16
804
15,144
359 368
3-Year Financial
Highlights
Singapore Airlines2
OVERVIEW