Singapore Airlines 2016 Annual Report Download - page 150
Download and view the complete annual report
Please find page 150 of the 2016 Singapore Airlines annual report below. You can navigate through the pages in the report by either clicking on the pages listed below, or by using the keyword search tool below to find specific information within the annual report.-
 1
1 -
2
-
3
-
4
-
5
-
6
-
7
-
8
-
9
-
10
-
11
-
12
-
13
-
14
-
15
-
16
-
17
-
18
-
19
-
20
-
21
-
22
-
23
-
24
-
25
-
26
-
27
-
28
-
29
-
30
-
31
-
32
-
33
-
34
-
35
-
36
-
37
-
38
-
39
-
40
-
41
-
42
-
43
-
44
-
45
-
46
-
47
-
48
-
49
-
50
-
51
-
52
-
53
-
54
-
55
-
56
-
57
-
58
-
59
-
60
-
61
-
62
-
63
-
64
-
65
-
66
-
67
-
68
-
69
-
70
-
71
-
72
-
73
-
74
-
75
-
76
-
77
-
78
-
79
-
80
-
81
-
82
-
83
-
84
-
85
-
86
-
87
-
88
-
89
-
90
-
91
-
92
-
93
-
94
-
95
-
96
-
97
-
98
-
99
-
100
-
101
-
102
-
103
-
104
-
105
-
106
-
107
-
108
-
109
-
110
-
111
-
112
-
113
-
114
-
115
-
116
-
117
-
118
-
119
-
120
-
121
-
122
-
123
-
124
-
125
-
126
-
127
-
128
-
129
-
130
-
131
-
132
-
133
-
134
-
135
-
136
-
137
-
138
-
139
-
 140
140 -
 141
141 -
 142
142 -
 143
143 -
 144
144 -
 145
145 -
 146
146 -
 147
147 -
 148
148 -
 149
149 -
 150
150 -
 151
151 -
 152
152 -
 153
153 -
 154
154 -
 155
155 -
 156
156 -
 157
157 -
 158
158 -
 159
159 -
 160
160 -
161
-
162
-
163
-
164
-
165
-
166
-
167
-
168
-
169
-
170
-
171
-
172
-
173
-
174
-
175
-
176
-
177
-
178
-
179
-
180
-
181
-
182
-
183
-
184
-
185
-
186
-
187
-
188
-
189
-
190
-
191
-
192
-
193
-
194
-
195
-
196
-
197
-
198
-
199
-
200
-
201
-
202
-
203
-
204
-
205
-
206
-
207
-
208
-
209
-
210
-
211
-
212
-
213
-
214
-
215
-
216
-
217
-
218
-
219
-
220
-
221
-
222
-
223
-
224
-
225
-
226
-
227
-
228
-
229
-
230
-
231
-
232
 |
 |

Notes to the Financial Statements
31 March 2016
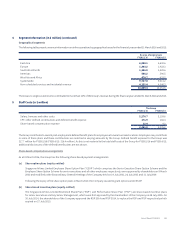
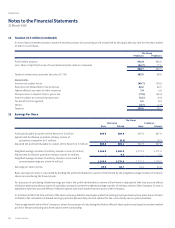
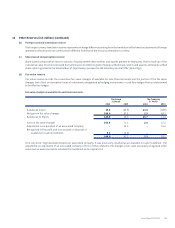
11 Taxation (in $ million) (continued)
A reconciliation between taxation expense and the product of accounting profit multiplied by the applicable tax rate for the years ended
31 March is as follows:
The Group
FY2015/16 FY2014/15
Profit before taxation 972.4 442.9
Less: Share of (profits)/losses of associated and joint venture companies (11.7) 77.1
960.7 520.0
Taxation at statutory corporate tax rate of 17.0% 163.3 88.4
Adjustments
Income not subject to tax (49.7) (39.1)
Expenses not deductible for tax purposes 12.2 26.5
Higher effective tax rates of other countries 7.4 5.6
Overprovision in respect of prior years, net (7.9) (52.3)
Income subject to concessionary tax rate (1.1) (0.3)
Tax benefit not recognised 1.1 8.4
Others (4.7) (1.0)
Taxation 120.6 36.2
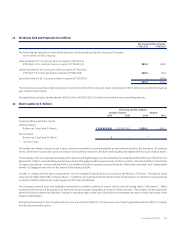
12 Earnings Per Share
The Group
FY2015/16 FY2014/15
Basic Diluted Basic Diluted
Profit attributable to owners of the Parent (in $ million) 804.4 804.4 367.9 367.9
Adjustment for dilutive potential ordinary shares of
subsidiary companies (in $ million) – (0.3) – (0.7)
Adjusted net profit attributable to owners of the Parent (in $ million) 804.4 804.1 367.9 367.2
Weighted average number of ordinary shares in issue (in million) 1,166.0 1,166.0 1,171.3 1,171.3
Adjustment for dilutive potential ordinary shares (in million) – 4.9 – 5.2
Weighted average number of ordinary shares in issue used for
computing earnings per share (in million) 1,166.0 1,170.9 1,171.3 1,176.5
Earnings per share (cents) 69.0 68.7 31.4 31.2
Basic earnings per share is calculated by dividing the profit attributable to owners of the Parent by the weighted average number of ordinary
shares in issue during the financial year.
For purposes of calculating diluted earnings per share, the profit attributable to owners of the Parent is adjusted to take into account eects
of dilutive potential ordinary shares of subsidiary companies and the weighted average number of ordinary shares of the Company in issue is
adjusted to take into account eects of dilutive options and share-based incentive plans of the Company.
17.6 million (FY2014/15: 18.6 million) of the share options granted to employees under the existing employee share option plans have not been
included in the calculation of diluted earnings per share because they are anti-dilutive for the current and previous year presented.
The average market value of the Company’s shares for purposes of calculating the dilutive eect of share options was based on quoted market
prices for the period during which the options were outstanding.
Singapore Airlines148
FINANCIAL