Singapore Airlines 2016 Annual Report Download - page 188
Download and view the complete annual report
Please find page 188 of the 2016 Singapore Airlines annual report below. You can navigate through the pages in the report by either clicking on the pages listed below, or by using the keyword search tool below to find specific information within the annual report.-
 1
1 -
2
-
3
-
4
-
5
-
6
-
7
-
8
-
9
-
10
-
11
-
12
-
13
-
14
-
15
-
16
-
17
-
18
-
19
-
20
-
21
-
22
-
23
-
24
-
25
-
26
-
27
-
28
-
29
-
30
-
31
-
32
-
33
-
34
-
35
-
36
-
37
-
38
-
39
-
40
-
41
-
42
-
43
-
44
-
45
-
46
-
47
-
48
-
49
-
50
-
51
-
52
-
53
-
54
-
55
-
56
-
57
-
58
-
59
-
60
-
61
-
62
-
63
-
64
-
65
-
66
-
67
-
68
-
69
-
70
-
71
-
72
-
73
-
74
-
75
-
76
-
77
-
78
-
79
-
80
-
81
-
82
-
83
-
84
-
85
-
86
-
87
-
88
-
89
-
90
-
91
-
92
-
93
-
94
-
95
-
96
-
97
-
98
-
99
-
100
-
101
-
102
-
103
-
104
-
105
-
106
-
107
-
108
-
109
-
110
-
111
-
112
-
113
-
114
-
115
-
116
-
117
-
118
-
119
-
120
-
121
-
122
-
123
-
124
-
125
-
126
-
127
-
128
-
129
-
130
-
131
-
132
-
133
-
134
-
135
-
136
-
137
-
138
-
139
-
140
-
141
-
142
-
143
-
144
-
145
-
146
-
147
-
148
-
149
-
150
-
151
-
152
-
153
-
154
-
155
-
156
-
157
-
158
-
159
-
160
-
161
-
162
-
163
-
164
-
165
-
166
-
167
-
168
-
169
-
170
-
171
-
172
-
173
-
174
-
175
-
176
-
177
-
 178
178 -
 179
179 -
 180
180 -
 181
181 -
 182
182 -
 183
183 -
 184
184 -
 185
185 -
 186
186 -
 187
187 -
 188
188 -
 189
189 -
 190
190 -
 191
191 -
 192
192 -
 193
193 -
 194
194 -
 195
195 -
 196
196 -
 197
197 -
 198
198 -
199
-
200
-
201
-
202
-
203
-
204
-
205
-
206
-
207
-
208
-
209
-
210
-
211
-
212
-
213
-
214
-
215
-
216
-
217
-
218
-
219
-
220
-
221
-
222
-
223
-
224
-
225
-
226
-
227
-
228
-
229
-
230
-
231
-
232
 |
 |
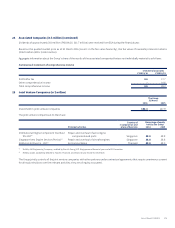
Notes to the Financial Statements
31 March 2016
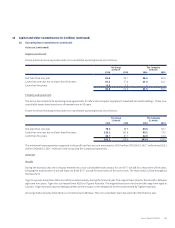
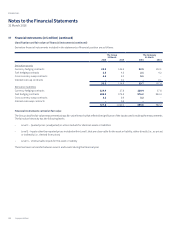
32 Cash and Bank Balances (in $ million)
The Group
31 March
The Company
31 March
2016 2015 2016 2015
Fixed deposits 3,002.7 4,034.8 2,822.9 4,007.6
Cash and bank balances 969.7 1,007.9 416.3 427.5
3,972.4 5,042.7 3,239.2 4,435.1
As at 31 March 2016, the composition of cash and bank balances held in foreign currencies by the Group is as follows: USD – 25.6% (2015: 16.8%),
EUR – 4.3% (2015: 1.1%) and AUD – 1.6% (2015: 1.5%).
Cash at bank earns interest at floating rates based on daily bank deposit rates ranging from 0.43% to 2.76% (FY2014/15: 0.01% to 2.55%) per
annum. Short-term deposits are made for varying periods of between one day and one year depending on the immediate cash requirements
of the Group, and earn interest at the respective short-term deposit rates. The weighted average eective interest rate for short-term deposits
is 1.45% (FY2014/15: 0.89%) per annum.
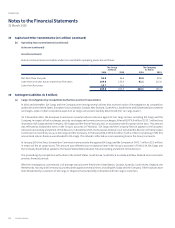
33 Trade and Other Creditors (in $ million)
The Group
31 March
The Company
31 March
2016 2015 2016 2015
Trade creditors 2,895.6 2,903.1 2,192.4 2,088.6
Amounts owing to associated companies 3.4 3.4 2.5 –
2,899.0 2,906.5 2,194.9 2,088.6
Funds from subsidiary companies – – 1,073.8 962.9
Amounts owing to subsidiary companies – – 117.3 85.8
– – 1,191.1 1,048.7
Trade and other creditors are non-interest bearing. Amounts owing to related parties are trade-related, unsecured, non-interest bearing,
repayable on demand and to be settled in cash. As at 31 March 2016, 9.9% (2015: 12.5%) of trade and other creditors were held in USD by the
Group. Included in trade and other creditors are amounts owing to related parties of $158.6 million (2015: $153.4 million) and $113.0 million
(2015: $115.8 million) for the Group and Company respectively.
Funds from subsidiary companies are unsecured and have varying repayment terms. Interest on funds from subsidiary companies are computed
using prevailing market rates which range from 0.01% to 1.53% (FY2014/15: 0.01% to 0.78%) per annum for SGD funds, and 0.32% to 1.23%
(FY2014/15: 0.05% to 1.00%) per annum for USD funds.
As at 31 March 2016, 33.9% of the funds from subsidiary companies are denominated in USD (2015: USD – 36.3%).
Amounts owing to subsidiary and associated companies are unsecured, trade-related, non-interest bearing and are repayable on demand.
Singapore Airlines186
FINANCIAL