Singapore Airlines 2016 Annual Report Download - page 175
Download and view the complete annual report
Please find page 175 of the 2016 Singapore Airlines annual report below. You can navigate through the pages in the report by either clicking on the pages listed below, or by using the keyword search tool below to find specific information within the annual report.-
 1
1 -
2
-
3
-
4
-
5
-
6
-
7
-
8
-
9
-
10
-
11
-
12
-
13
-
14
-
15
-
16
-
17
-
18
-
19
-
20
-
21
-
22
-
23
-
24
-
25
-
26
-
27
-
28
-
29
-
30
-
31
-
32
-
33
-
34
-
35
-
36
-
37
-
38
-
39
-
40
-
41
-
42
-
43
-
44
-
45
-
46
-
47
-
48
-
49
-
50
-
51
-
52
-
53
-
54
-
55
-
56
-
57
-
58
-
59
-
60
-
61
-
62
-
63
-
64
-
65
-
66
-
67
-
68
-
69
-
70
-
71
-
72
-
73
-
74
-
75
-
76
-
77
-
78
-
79
-
80
-
81
-
82
-
83
-
84
-
85
-
86
-
87
-
88
-
89
-
90
-
91
-
92
-
93
-
94
-
95
-
96
-
97
-
98
-
99
-
100
-
101
-
102
-
103
-
104
-
105
-
106
-
107
-
108
-
109
-
110
-
111
-
112
-
113
-
114
-
115
-
116
-
117
-
118
-
119
-
120
-
121
-
122
-
123
-
124
-
125
-
126
-
127
-
128
-
129
-
130
-
131
-
132
-
133
-
134
-
135
-
136
-
137
-
138
-
139
-
140
-
141
-
142
-
143
-
144
-
145
-
146
-
147
-
148
-
149
-
150
-
151
-
152
-
153
-
154
-
155
-
156
-
157
-
158
-
159
-
160
-
161
-
162
-
163
-
164
-
 165
165 -
 166
166 -
 167
167 -
 168
168 -
 169
169 -
 170
170 -
 171
171 -
 172
172 -
 173
173 -
 174
174 -
 175
175 -
 176
176 -
 177
177 -
 178
178 -
 179
179 -
 180
180 -
 181
181 -
 182
182 -
 183
183 -
 184
184 -
 185
185 -
186
-
187
-
188
-
189
-
190
-
191
-
192
-
193
-
194
-
195
-
196
-
197
-
198
-
199
-
200
-
201
-
202
-
203
-
204
-
205
-
206
-
207
-
208
-
209
-
210
-
211
-
212
-
213
-
214
-
215
-
216
-
217
-
218
-
219
-
220
-
221
-
222
-
223
-
224
-
225
-
226
-
227
-
228
-
229
-
230
-
231
-
232
 |
 |

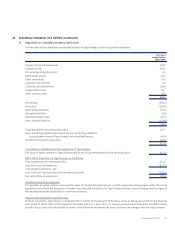
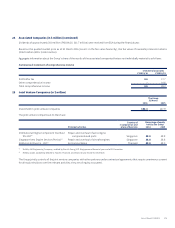
23 Subsidiary Companies (in $ million) (continued)
(f) Acquisition of a subsidiary company (continued)
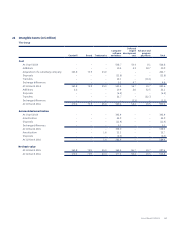
The fair value of the identifiable assets and liabilities of Tiger Airways as at the acquisition date were:
Fair value
recognised on
acquisition
Tigerair brand and trademarks 100.9
Tangible assets 553.1
Pre-existing intangible assets 0.1
Deferred tax assets 12.1
Other receivables 10.6
Long-term investments 8.3
Cash and cash equivalents 135.6
Assets held for sale 20.7
Other current assets 56.8
898.2
Borrowings (345.2)
Provisions (156.8)
Deferred tax liabilities (21.3)
Derivative liabilities (9.4)
Liabilities held for sale (10.4)
Other current liabilities (252.4)
(795.5)
Total identifiable net assets at fair value 102.7
Non-controlling interest measured at the non-controlling interest's
proportionate share of Tiger Airways' net identifiable assets (49.3)
Goodwill arising from acquisition 163.8
217.2
Consideration transferred for the acquisition of Tiger Airways
Fair value of equity interest in Tiger Airways held by the Group immediately before the acquisition 217.2
Effect of the acquisition of Tiger Airways on cash flows
Total consideration for the acquisition 217.2
Less: Non-cash consideration (217.2)
Consideration settled in cash –
Less: Cash and cash equivalents of subsidiary acquired (135.6)
Net cash inflow on acquisition 135.6
Goodwill arising from acquisition
The goodwill of $163.8 million comprised the value of strengthening the Group’s portfolio approach and synergies within the Group
expected to arise from the acquisition. Goodwill was allocated entirely to the Tiger Airways business. None of the goodwill recognised
was expected to be tax deductible for income tax purposes.
Impact of the acquisition on profit or loss
From its acquisition, Tiger Airways contributed $357.0 million of revenue and $9.9 million of loss to the Group’s profit for the financial
year ended 31 March 2015. If the acquisition had taken place on 1 April 2014, the Group’s revenue would have been $15,886.1 million
and the Group’s net profit attributable to owners of the Parent would remain the same, as there is no change in the net equity interest.
Annual Report FY2015/16 173