Singapore Airlines 2016 Annual Report Download - page 185
Download and view the complete annual report
Please find page 185 of the 2016 Singapore Airlines annual report below. You can navigate through the pages in the report by either clicking on the pages listed below, or by using the keyword search tool below to find specific information within the annual report.-
 1
1 -
2
-
3
-
4
-
5
-
6
-
7
-
8
-
9
-
10
-
11
-
12
-
13
-
14
-
15
-
16
-
17
-
18
-
19
-
20
-
21
-
22
-
23
-
24
-
25
-
26
-
27
-
28
-
29
-
30
-
31
-
32
-
33
-
34
-
35
-
36
-
37
-
38
-
39
-
40
-
41
-
42
-
43
-
44
-
45
-
46
-
47
-
48
-
49
-
50
-
51
-
52
-
53
-
54
-
55
-
56
-
57
-
58
-
59
-
60
-
61
-
62
-
63
-
64
-
65
-
66
-
67
-
68
-
69
-
70
-
71
-
72
-
73
-
74
-
75
-
76
-
77
-
78
-
79
-
80
-
81
-
82
-
83
-
84
-
85
-
86
-
87
-
88
-
89
-
90
-
91
-
92
-
93
-
94
-
95
-
96
-
97
-
98
-
99
-
100
-
101
-
102
-
103
-
104
-
105
-
106
-
107
-
108
-
109
-
110
-
111
-
112
-
113
-
114
-
115
-
116
-
117
-
118
-
119
-
120
-
121
-
122
-
123
-
124
-
125
-
126
-
127
-
128
-
129
-
130
-
131
-
132
-
133
-
134
-
135
-
136
-
137
-
138
-
139
-
140
-
141
-
142
-
143
-
144
-
145
-
146
-
147
-
148
-
149
-
150
-
151
-
152
-
153
-
154
-
155
-
156
-
157
-
158
-
159
-
160
-
161
-
162
-
163
-
164
-
165
-
166
-
167
-
168
-
169
-
170
-
171
-
172
-
173
-
174
-
 175
175 -
 176
176 -
 177
177 -
 178
178 -
 179
179 -
 180
180 -
 181
181 -
 182
182 -
 183
183 -
 184
184 -
 185
185 -
 186
186 -
 187
187 -
 188
188 -
 189
189 -
 190
190 -
 191
191 -
 192
192 -
 193
193 -
 194
194 -
 195
195 -
196
-
197
-
198
-
199
-
200
-
201
-
202
-
203
-
204
-
205
-
206
-
207
-
208
-
209
-
210
-
211
-
212
-
213
-
214
-
215
-
216
-
217
-
218
-
219
-
220
-
221
-
222
-
223
-
224
-
225
-
226
-
227
-
228
-
229
-
230
-
231
-
232
 |
 |

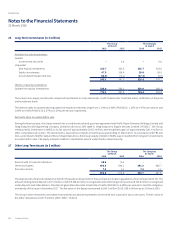
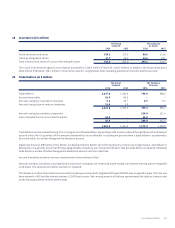
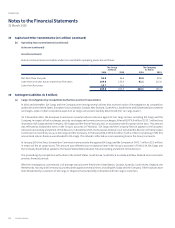
28 Inventories (in $ million)
The Group
31 March
The Company
31 March
2016 2015 2016 2015
Technical stocks and stores 154.2 173.0 88.6 111.6
Catering and general stocks 27.7 29.0 19.6 20.1
Total inventories at lower of cost and net realisable value 181.9 202.0 108.2 131.7
The cost of inventories recognised as an expense amounted to $118.4 million (FY2014/15: $106.0 million). In addition, the Group wrote down
$26.6 million (FY2014/15: $38.1 million) of inventories, which is recognised as other operating expenses in the profit and loss account.
29 Trade Debtors (in $ million)
The Group
31 March
The Company
31 March
2016 2015 2016 2015
Trade debtors 1,137.8 1,380.8 798.9 998.2
Accrued receivables 61.9 86.2 – –
Amounts owing by associated companies 9.1 20.7 0.5 0.1
Amounts owing by joint venture companies 13.0 3.8 – –
1,221.8 1,491.5 799.4 998.3
Amounts owing by subsidiary companies – – 318.0 311.5
Loan receivable from an associated company 62.0 – 62.0 –
62.0 – 380.0 311.5
1,283.8 1,491.5 1,179.4 1,309.8
Trade debtors are non-interest bearing. The carrying amount of trade debtors impaired by credit losses is reduced through the use of an allowance
account unless the Group writes o the amount ascertained to be uncollectible. In subsequent periods when a trade debtor is ascertained to
be uncollectible, it is written o against the allowance account.
Significant financial diiculties of the debtor, probability that the debtor will enter bankruptcy or financial reorganisation, and default or
delinquency in payments (more than 90 days aging of debtor balances) are considered indicators that the trade debtor is impaired. Individual
trade debtor is written o when Management deems the amount not to be collectible.
Accrued receivables pertain to services rendered which have not been billed.
Amounts owing by subsidiary, associated and joint venture companies are unsecured, trade-related, non-interest bearing and are repayable
on demand. The amounts are neither overdue nor impaired.
The interest on a short-term loan to an associated company was computed using Bank Bill Swap Bid Rate plus an agreed margin. The loan was
denominated in AUD and the interest rate was 10.345% per annum. Net carrying amount of the loan approximates fair value as interest rates
on the loan approximate market interest rates.
Annual Report FY2015/16 183