Singapore Airlines 2016 Annual Report Download - page 169
Download and view the complete annual report
Please find page 169 of the 2016 Singapore Airlines annual report below. You can navigate through the pages in the report by either clicking on the pages listed below, or by using the keyword search tool below to find specific information within the annual report.-
 1
1 -
2
-
3
-
4
-
5
-
6
-
7
-
8
-
9
-
10
-
11
-
12
-
13
-
14
-
15
-
16
-
17
-
18
-
19
-
20
-
21
-
22
-
23
-
24
-
25
-
26
-
27
-
28
-
29
-
30
-
31
-
32
-
33
-
34
-
35
-
36
-
37
-
38
-
39
-
40
-
41
-
42
-
43
-
44
-
45
-
46
-
47
-
48
-
49
-
50
-
51
-
52
-
53
-
54
-
55
-
56
-
57
-
58
-
59
-
60
-
61
-
62
-
63
-
64
-
65
-
66
-
67
-
68
-
69
-
70
-
71
-
72
-
73
-
74
-
75
-
76
-
77
-
78
-
79
-
80
-
81
-
82
-
83
-
84
-
85
-
86
-
87
-
88
-
89
-
90
-
91
-
92
-
93
-
94
-
95
-
96
-
97
-
98
-
99
-
100
-
101
-
102
-
103
-
104
-
105
-
106
-
107
-
108
-
109
-
110
-
111
-
112
-
113
-
114
-
115
-
116
-
117
-
118
-
119
-
120
-
121
-
122
-
123
-
124
-
125
-
126
-
127
-
128
-
129
-
130
-
131
-
132
-
133
-
134
-
135
-
136
-
137
-
138
-
139
-
140
-
141
-
142
-
143
-
144
-
145
-
146
-
147
-
148
-
149
-
150
-
151
-
152
-
153
-
154
-
155
-
156
-
157
-
158
-
 159
159 -
 160
160 -
 161
161 -
 162
162 -
 163
163 -
 164
164 -
 165
165 -
 166
166 -
 167
167 -
 168
168 -
 169
169 -
 170
170 -
 171
171 -
 172
172 -
 173
173 -
 174
174 -
 175
175 -
 176
176 -
 177
177 -
 178
178 -
 179
179 -
180
-
181
-
182
-
183
-
184
-
185
-
186
-
187
-
188
-
189
-
190
-
191
-
192
-
193
-
194
-
195
-
196
-
197
-
198
-
199
-
200
-
201
-
202
-
203
-
204
-
205
-
206
-
207
-
208
-
209
-
210
-
211
-
212
-
213
-
214
-
215
-
216
-
217
-
218
-
219
-
220
-
221
-
222
-
223
-
224
-
225
-
226
-
227
-
228
-
229
-
230
-
231
-
232
 |
 |

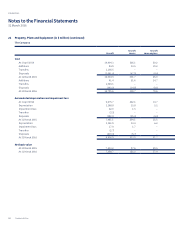
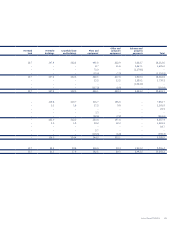
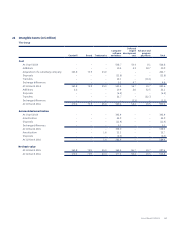
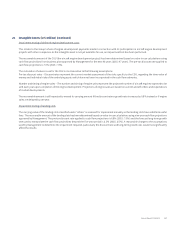
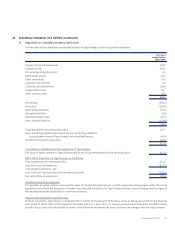
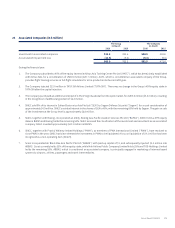
22 Intangible Assets (in $ million) (continued)
Impairment testing of deferred engine development costs
This relates to the Group’s share of engine development payments made in connection with its participation in aircra engine development
projects with other companies. As the intangible asset is not yet available for use, an impairment test has been performed.
The recoverable amount of the CGU (the aircra engine development project) has been determined based on value-in-use calculations using
cash flow projections from business plan approved by Management for the next 46 years (2015: 47 years). The pre-tax discount rate applied to
cash flow projections is 7.0% (2015: 7.0%).
The calculation of value-in-use for the CGU is most sensitive to the following assumptions:
Pre-tax discount rates – Discount rates represent the current market assessment of the risks specific to the CGU, regarding the time value of
money and individual risks of the underlying assets which have not been incorporated in the cash flow estimates.
Number and timing of engine sales – The number and timing of engine sales represent the projected number of aircra engines expected to be
sold each year upon completion of the engine development. Projections of engine sales are based on current aircra orders and expectations
of market developments.
The recoverable amount is still expected to exceed its carrying amount if the discount rate or growth rate increases by 0.8% instead or if engine
sales are delayed by one year.
Impairment testing of landing slots
The carrying value of the landing slots classified under “others” is assessed for impairment annually as the landing slots have indefinite useful
lives. The recoverable amount of the landing slots has been determined based on value-in-use calculations using nine-year cash flow projections
approved by Management. The pre-tax discount rate applied to cash flow projections is 6.8% (2015: 7.0%) and the forecast long-term growth
rate used to extrapolate the cash flow projections beyond the five-year period is 2.5% (2015: 2.5%). A reasonable change to the assumptions
used by Management to determine the impairment required, particularly the discount rate and long-term growth rate, would not significantly
aect the results.
Annual Report FY2015/16 167