Singapore Airlines 2016 Annual Report Download - page 207
Download and view the complete annual report
Please find page 207 of the 2016 Singapore Airlines annual report below. You can navigate through the pages in the report by either clicking on the pages listed below, or by using the keyword search tool below to find specific information within the annual report.-
 1
1 -
2
-
3
-
4
-
5
-
6
-
7
-
8
-
9
-
10
-
11
-
12
-
13
-
14
-
15
-
16
-
17
-
18
-
19
-
20
-
21
-
22
-
23
-
24
-
25
-
26
-
27
-
28
-
29
-
30
-
31
-
32
-
33
-
34
-
35
-
36
-
37
-
38
-
39
-
40
-
41
-
42
-
43
-
44
-
45
-
46
-
47
-
48
-
49
-
50
-
51
-
52
-
53
-
54
-
55
-
56
-
57
-
58
-
59
-
60
-
61
-
62
-
63
-
64
-
65
-
66
-
67
-
68
-
69
-
70
-
71
-
72
-
73
-
74
-
75
-
76
-
77
-
78
-
79
-
80
-
81
-
82
-
83
-
84
-
85
-
86
-
87
-
88
-
89
-
90
-
91
-
92
-
93
-
94
-
95
-
96
-
97
-
98
-
99
-
100
-
101
-
102
-
103
-
104
-
105
-
106
-
107
-
108
-
109
-
110
-
111
-
112
-
113
-
114
-
115
-
116
-
117
-
118
-
119
-
120
-
121
-
122
-
123
-
124
-
125
-
126
-
127
-
128
-
129
-
130
-
131
-
132
-
133
-
134
-
135
-
136
-
137
-
138
-
139
-
140
-
141
-
142
-
143
-
144
-
145
-
146
-
147
-
148
-
149
-
150
-
151
-
152
-
153
-
154
-
155
-
156
-
157
-
158
-
159
-
160
-
161
-
162
-
163
-
164
-
165
-
166
-
167
-
168
-
169
-
170
-
171
-
172
-
173
-
174
-
175
-
176
-
177
-
178
-
179
-
180
-
181
-
182
-
183
-
184
-
185
-
186
-
187
-
188
-
189
-
190
-
191
-
192
-
193
-
194
-
195
-
196
-
 197
197 -
 198
198 -
 199
199 -
 200
200 -
 201
201 -
 202
202 -
 203
203 -
 204
204 -
 205
205 -
 206
206 -
 207
207 -
 208
208 -
 209
209 -
 210
210 -
 211
211 -
 212
212 -
 213
213 -
 214
214 -
 215
215 -
 216
216 -
 217
217 -
218
-
219
-
220
-
221
-
222
-
223
-
224
-
225
-
226
-
227
-
228
-
229
-
230
-
231
-
232
 |
 |

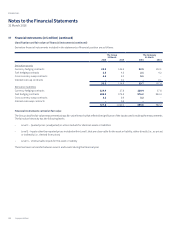
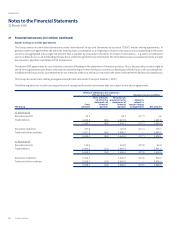
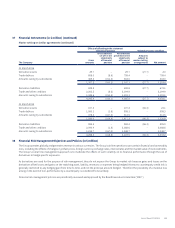
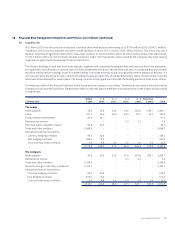
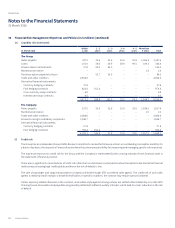
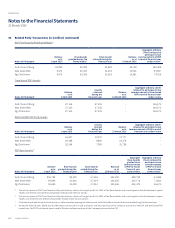
38 Financial Risk Management Objectives and Policies (in $ million) (continued)
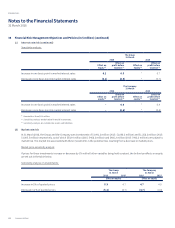
(e) Liquidity risk
At 31 March 2016, the Group has at its disposal, cash and short-term deposits amounting to $3,972.4 million (2015: $5,042.7 million).
In addition, the Group has available short-term credit facilities of about $375.0 million (2015: $400.0 million). The Group also has a
Medium Term Note Programme under which it may issue notes up to $2,000.0 million (2015: $2,000.0 million) and as of 31 March 2016,
$1,000.0 million (2015: $1,000.0 million) remains unutilised. Under this Programme, notes issued by the Company may have varying
maturities as agreed with the relevant financial institutions.
The Group’s holdings of cash and short-term deposits, together with committed funding facilities and net cash flow from operations,
are expected to be suicient to cover the cost of all firm aircra deliveries due in the next financial year. It is expected that any shortfall
would be met by bank borrowings or public market funding. Due to the necessity to plan aircra orders well in advance of delivery, it is
not economical for the Group to have committed funding in place at present for all outstanding orders, many of which relate to aircra
which will not be delivered for several years. The Group’s policies in this regard are in line with the funding policies of other major airlines.
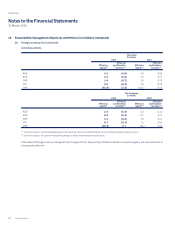
The maturity profile of the financial liabilities of the Group and the Company is as follows. The amounts disclosed in the table are the
contractual undiscounted cash flows. Balances due within 12 months approximate their carrying amounts as the impact of discounting
is insignificant.
31 March 2016
Within
1 year
1 - 2
years
2 - 3
years
3 - 4
years
4 - 5
years
More than
5 years Total
The Group
Notes payable 33.6 33.6 33.6 33.6 525.6 542.7 1,202.7
Loans 197.5 20.6 20.6 22.5 22.7 36.4 320.3
Finance lease commitments 23.8 23.7 – – – – 47.5
Maintenance reserve – – – 2.3 3.1 – 5.4
Purchase option payable to lessor 50.8 33.9 – – – – 84.7
Trade and other creditors 2,848.2 – – – – – 2,848.2
Derivative financial instruments:
Currency hedging contracts 96.3 32.8 – – – – 129.1
Fuel hedging contracts 524.6 75.6 – – – – 600.2
Cross currency swap contracts 0.5 4.8 3.0 2.0 1.0 0.2 11.5
3,775.3 225.0 57.2 60.4 552.4 579.3 5,249.6
The Company
Notes payable 33.6 33.6 33.6 33.6 525.6 542.7 1,202.7
Maintenance reserve – – – 2.3 3.1 – 5.4
Trade and other creditors 2,194.9 – – – – – 2,194.9
Amounts owing to subsidiary companies 1,191.1 – – – – – 1,191.1
Derivative financial instruments:
Currency hedging contracts 92.3 32.8 – – – – 125.1
Fuel hedging contracts 500.6 75.6 – – – – 576.2
Cross currency swap contracts 0.5 4.8 3.0 2.0 1.0 0.2 11.5
4,013.0 146.8 36.6 37.9 529.7 542.9 5,306.9
Annual Report FY2015/16 205