Singapore Airlines 2016 Annual Report Download - page 47
Download and view the complete annual report
Please find page 47 of the 2016 Singapore Airlines annual report below. You can navigate through the pages in the report by either clicking on the pages listed below, or by using the keyword search tool below to find specific information within the annual report.-
 1
1 -
2
-
3
-
4
-
5
-
6
-
7
-
8
-
9
-
10
-
11
-
12
-
13
-
14
-
15
-
16
-
17
-
18
-
19
-
20
-
21
-
22
-
23
-
24
-
25
-
26
-
27
-
28
-
29
-
30
-
31
-
32
-
33
-
34
-
35
-
36
-
 37
37 -
 38
38 -
 39
39 -
 40
40 -
 41
41 -
 42
42 -
 43
43 -
 44
44 -
 45
45 -
 46
46 -
 47
47 -
 48
48 -
 49
49 -
 50
50 -
 51
51 -
 52
52 -
 53
53 -
 54
54 -
 55
55 -
 56
56 -
 57
57 -
58
-
59
-
60
-
61
-
62
-
63
-
64
-
65
-
66
-
67
-
68
-
69
-
70
-
71
-
72
-
73
-
74
-
75
-
76
-
77
-
78
-
79
-
80
-
81
-
82
-
83
-
84
-
85
-
86
-
87
-
88
-
89
-
90
-
91
-
92
-
93
-
94
-
95
-
96
-
97
-
98
-
99
-
100
-
101
-
102
-
103
-
104
-
105
-
106
-
107
-
108
-
109
-
110
-
111
-
112
-
113
-
114
-
115
-
116
-
117
-
118
-
119
-
120
-
121
-
122
-
123
-
124
-
125
-
126
-
127
-
128
-
129
-
130
-
131
-
132
-
133
-
134
-
135
-
136
-
137
-
138
-
139
-
140
-
141
-
142
-
143
-
144
-
145
-
146
-
147
-
148
-
149
-
150
-
151
-
152
-
153
-
154
-
155
-
156
-
157
-
158
-
159
-
160
-
161
-
162
-
163
-
164
-
165
-
166
-
167
-
168
-
169
-
170
-
171
-
172
-
173
-
174
-
175
-
176
-
177
-
178
-
179
-
180
-
181
-
182
-
183
-
184
-
185
-
186
-
187
-
188
-
189
-
190
-
191
-
192
-
193
-
194
-
195
-
196
-
197
-
198
-
199
-
200
-
201
-
202
-
203
-
204
-
205
-
206
-
207
-
208
-
209
-
210
-
211
-
212
-
213
-
214
-
215
-
216
-
217
-
218
-
219
-
220
-
221
-
222
-
223
-
224
-
225
-
226
-
227
-
228
-
229
-
230
-
231
-
232
 |
 |

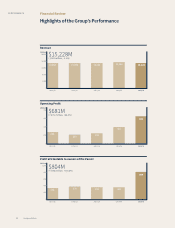
Performance of the Group
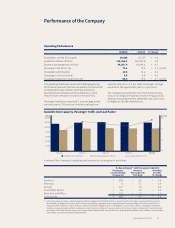
Key Financial Highlights
2015/16 2014/15 % Change
Earnings For The Year ($ million)
Revenue 15,228.5 15,565.5 – 2.2
Expenditure 14,547.3 15,156.1 – 4.0
Operating profit 681.2 409.4 + 66.4
Profit attributable to owners of the Parent 804.4 367.9 + 118.6
Per Share Data (cents)
Earnings per share – basic 69.0 31.4 + 119.7
Ordinary dividend per share 45.0 22.0 + 104.5
Ratios (%)
Return on equity holders’ funds 6.4 2.9 + 3.5 points
Return on total assets 3.6 1.7 + 1.9 points
R1 Tiger Airways was consolidated as a subsidiary with eect from October 2014.
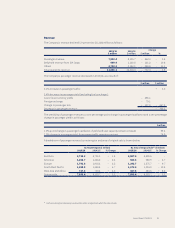
2015/16 2014/15
$ million $ million
Airline operations 12,775.0 12,855.7
Cargo operations 2,037.1 2,234.8
Engineering services 395.8 437.8
Others 20.6 37.2
Total revenue 15,228.5 15,565.5
The Group continued to face strong headwinds during
the financial year with intense competition in key
markets, caused in part by weak economic activity
and relatively rapid capacity growth in the industry,
placing downward pressure on yields as evident from
aggressive fare promotional activities.
Jet fuel prices fell 41.3 per cent year-on-year to an
average USD62 per barrel, translating to substantial cost
relief for the Group amidst a weak yield environment.
Group revenue fell $338 million against last year to
$15,228 million, mainly attributable to lower revenue
from cargo and airline operations. Cargo revenue
deteriorated largely from yield contraction (-11.6 per cent),
partially cushioned by higher load carried (+2.6 per cent).
Revenue from airline operations was lower, weighed
down by a decline in passenger revenue from Singapore
Airlines Limited (“the Parent Airline Company” or “the
Company”) on the back of soer yields, and other
incidental revenue. On the other hand, higher passenger
revenue from Scoot Pte. Ltd. (“Scoot”) and SilkAir
(Singapore) Private Limited (“SilkAir”) from expanded
operations, coupled with the incorporation of Tiger
Airways Holdings Limited’s (“Tiger Airways”) full year
resultsR1 in 2015/16 financial year mitigated some of the
decline. Engineering services revenue fell mainly as a
result of lower overhaul activities. The Group’s revenue
by business segment is shown below:
Group Earnings
Annual Report FY2015/16 45