Singapore Airlines 2016 Annual Report Download - page 53
Download and view the complete annual report
Please find page 53 of the 2016 Singapore Airlines annual report below. You can navigate through the pages in the report by either clicking on the pages listed below, or by using the keyword search tool below to find specific information within the annual report.-
 1
1 -
2
-
3
-
4
-
5
-
6
-
7
-
8
-
9
-
10
-
11
-
12
-
13
-
14
-
15
-
16
-
17
-
18
-
19
-
20
-
21
-
22
-
23
-
24
-
25
-
26
-
27
-
28
-
29
-
30
-
31
-
32
-
33
-
34
-
35
-
36
-
37
-
38
-
39
-
40
-
41
-
42
-
 43
43 -
 44
44 -
 45
45 -
 46
46 -
 47
47 -
 48
48 -
 49
49 -
 50
50 -
 51
51 -
 52
52 -
 53
53 -
 54
54 -
 55
55 -
 56
56 -
 57
57 -
 58
58 -
 59
59 -
 60
60 -
 61
61 -
 62
62 -
 63
63 -
64
-
65
-
66
-
67
-
68
-
69
-
70
-
71
-
72
-
73
-
74
-
75
-
76
-
77
-
78
-
79
-
80
-
81
-
82
-
83
-
84
-
85
-
86
-
87
-
88
-
89
-
90
-
91
-
92
-
93
-
94
-
95
-
96
-
97
-
98
-
99
-
100
-
101
-
102
-
103
-
104
-
105
-
106
-
107
-
108
-
109
-
110
-
111
-
112
-
113
-
114
-
115
-
116
-
117
-
118
-
119
-
120
-
121
-
122
-
123
-
124
-
125
-
126
-
127
-
128
-
129
-
130
-
131
-
132
-
133
-
134
-
135
-
136
-
137
-
138
-
139
-
140
-
141
-
142
-
143
-
144
-
145
-
146
-
147
-
148
-
149
-
150
-
151
-
152
-
153
-
154
-
155
-
156
-
157
-
158
-
159
-
160
-
161
-
162
-
163
-
164
-
165
-
166
-
167
-
168
-
169
-
170
-
171
-
172
-
173
-
174
-
175
-
176
-
177
-
178
-
179
-
180
-
181
-
182
-
183
-
184
-
185
-
186
-
187
-
188
-
189
-
190
-
191
-
192
-
193
-
194
-
195
-
196
-
197
-
198
-
199
-
200
-
201
-
202
-
203
-
204
-
205
-
206
-
207
-
208
-
209
-
210
-
211
-
212
-
213
-
214
-
215
-
216
-
217
-
218
-
219
-
220
-
221
-
222
-
223
-
224
-
225
-
226
-
227
-
228
-
229
-
230
-
231
-
232
 |
 |

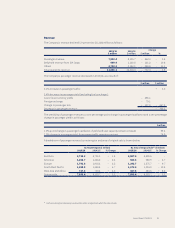
R3 Each route region comprises routes originating from Singapore to final destinations in countries within the region concerned and vice versa.
For example, Singapore-Hong Kong-San Francisco-Hong Kong-Singapore route is classified under Americas region. East Asia covers Brunei,
Hong Kong SAR, Indonesia, Japan, Malaysia, Myanmar, People's Republic of China, Philippines, South Korea, Taiwan, Thailand and Vietnam.
Americas comprises Brazil and USA. Europe consists of Denmark, England, France, Germany, Italy, Russia, Spain, Switzerland, The Netherlands
and Turkey. South West Pacific covers Australia and New Zealand. West Asia and Africa is made up of Bangladesh, India, Maldives, Saudi Arabia,
South Africa, Sri Lanka and United Arab Emirates.
A review of the Company’s operating performance by route region is as follows:
By Route RegionR3 (2015/16 against 2014/15)
Passengers
Carried Change
(thousand)
Revenue
Passenger KM
% Change
Available
Seat KM
% Change
East Asia + 259 + 2.3 + 0.8
Americas – 6 – 0.7 – 0.9
Europe – 117 – 1.4 – 0.4
South West Pacific + 26 – 1.0 – 5.3
West Asia and Africa + 130 + 1.5 – 2.0
Systemwide + 292 + 0.1 – 1.4
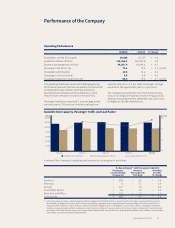
The operating landscape remained challenging during
the financial year with intense competition and economic
uncertainties in key markets. Tactical promotions
launched to boost loads pushed yields down, which
shrank 5.4 per cent year-on-year to a five-year low.
Passenger load factor improved 1.1 percentage points
over last year to 79.6 per cent, mainly resulting from
capacity reduction (-1.4 per cent). Passenger carriage
was almost flat against last year (+0.1 per cent).
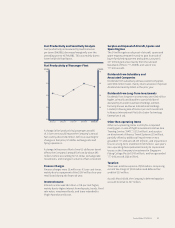
The Company launched the new Premium Economy
class on its Singapore-Sydney route on 9 August 2015,
and has since progressively added the new cabin class
on flights to 16 other destinations.
Operating Performance
2015/16 2014/15 % Change
Passengers carried (thousand) 19,029 18,737 + 1.6
Available seat-km (million) 118,366.5 120,000.8 – 1.4
Revenue passenger-km (million) 94,267.4 94,209.2 + 0.1
Passenger load factor (%) 79.6 78.5 + 1.1 points
Passenger yield (¢/pkm) 10.6 11.2 – 5.4
Passenger unit cost (¢/ask) 8.5 8.9 – 4.5
Passenger breakeven load factor (%) 80.2 79.5 + 0.7 points
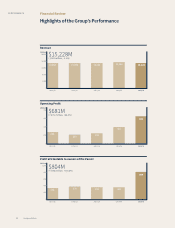
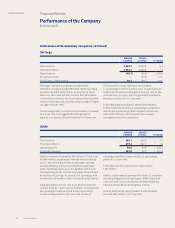
Performance of the Company
Available Seat Capacity, Passenger Traic and Load Factor
140,000
120,000
100,000
80,000
60,000
40,000
20,000
0
80
78
76
74
Per CentMillion
2011/12 2012/13 2013/14 2014/15 2015/16
Revenue Passenger-km (Million) Passenger Load Factor (%) Available Seat-km (Million)
Annual Report FY2015/16 51