Singapore Airlines 2016 Annual Report Download - page 59
Download and view the complete annual report
Please find page 59 of the 2016 Singapore Airlines annual report below. You can navigate through the pages in the report by either clicking on the pages listed below, or by using the keyword search tool below to find specific information within the annual report.-
 1
1 -
2
-
3
-
4
-
5
-
6
-
7
-
8
-
9
-
10
-
11
-
12
-
13
-
14
-
15
-
16
-
17
-
18
-
19
-
20
-
21
-
22
-
23
-
24
-
25
-
26
-
27
-
28
-
29
-
30
-
31
-
32
-
33
-
34
-
35
-
36
-
37
-
38
-
39
-
40
-
41
-
42
-
43
-
44
-
45
-
46
-
47
-
48
-
 49
49 -
 50
50 -
 51
51 -
 52
52 -
 53
53 -
 54
54 -
 55
55 -
 56
56 -
 57
57 -
 58
58 -
 59
59 -
 60
60 -
 61
61 -
 62
62 -
 63
63 -
 64
64 -
 65
65 -
 66
66 -
 67
67 -
 68
68 -
 69
69 -
70
-
71
-
72
-
73
-
74
-
75
-
76
-
77
-
78
-
79
-
80
-
81
-
82
-
83
-
84
-
85
-
86
-
87
-
88
-
89
-
90
-
91
-
92
-
93
-
94
-
95
-
96
-
97
-
98
-
99
-
100
-
101
-
102
-
103
-
104
-
105
-
106
-
107
-
108
-
109
-
110
-
111
-
112
-
113
-
114
-
115
-
116
-
117
-
118
-
119
-
120
-
121
-
122
-
123
-
124
-
125
-
126
-
127
-
128
-
129
-
130
-
131
-
132
-
133
-
134
-
135
-
136
-
137
-
138
-
139
-
140
-
141
-
142
-
143
-
144
-
145
-
146
-
147
-
148
-
149
-
150
-
151
-
152
-
153
-
154
-
155
-
156
-
157
-
158
-
159
-
160
-
161
-
162
-
163
-
164
-
165
-
166
-
167
-
168
-
169
-
170
-
171
-
172
-
173
-
174
-
175
-
176
-
177
-
178
-
179
-
180
-
181
-
182
-
183
-
184
-
185
-
186
-
187
-
188
-
189
-
190
-
191
-
192
-
193
-
194
-
195
-
196
-
197
-
198
-
199
-
200
-
201
-
202
-
203
-
204
-
205
-
206
-
207
-
208
-
209
-
210
-
211
-
212
-
213
-
214
-
215
-
216
-
217
-
218
-
219
-
220
-
221
-
222
-
223
-
224
-
225
-
226
-
227
-
228
-
229
-
230
-
231
-
232
 |
 |

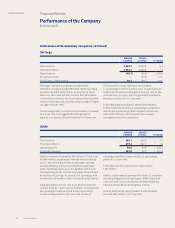
Performance of the Subsidiary Companies
The major subsidiary companies are SIAEC, SIA Cargo, SilkAir, Scoot, and Tiger Airways. The following performance
review includes intra-group transactions.
Revenue fell by 0.6 per cent from $1,120 million
to $1,114 million. The decrease in airframe and
component overhaul revenue was mitigated in part
by higher line maintenance and fleet management
revenue. Expenditure fell at a higher rate of 2.5 per cent
or $26 million to $1,010 million, in spite of a $13 million
exchange loss incurred versus a $5 million exchange
gain in the previous year. Subcontract and sta costs
registered the biggest reductions year-on-year. With
expenditure decreasing at a higher rate than revenue,
operating profit increased $20 million or 23.5 per cent
to $104 million.
Share of profits from associated and joint venture
companies at $93 million saw a decrease of $15 million
or 13.8 per cent. Contributions from the engine repair
and overhaul centres reduced, mainly due to lower
work content on the engines serviced by Singapore
Aero Engine Services Pte Ltd.
During the year, SIAEC recognised a $4 million loss on
the closure of an associated company, and a $3 million
provision for impairment on another associated
company. In addition, SIAEC recorded a $3 million
surplus on the partial disposal of an associated
company. This is in contrast with the $6 million gain
recognised last year from restructuring of one of its
subsidiaries.
SIAEC recorded a profit attributable to owners
of the parent of $175 million for the financial year
ended 31 March 2016, $10 million or 5.5 per cent lower
than last year.
As at 31 March 2016, SIAEC’s equity attributable to
owners of the Parent of $1,486 million was $161 million
or 12.2 per cent higher than at 31 March 2015. Net asset
value per share of $1.32 as at 31 March 2016 was $0.14
or 11.9 per cent higher than last year.
Basic earnings per share was 15.7 cents for the current
financial year.
SIAEC
2015/16
$ million
2014/15
$ million % Change
Total revenue 1,113.5 1,119.7 – 0.6
Total expenditure 1,009.4 1,035.4 – 2.5
Operating profit 104.1 84.3 + 23.5
Net profit 174.9 185.0 – 5.5
Annual Report FY2015/16 57