Singapore Airlines 2016 Annual Report Download - page 54
Download and view the complete annual report
Please find page 54 of the 2016 Singapore Airlines annual report below. You can navigate through the pages in the report by either clicking on the pages listed below, or by using the keyword search tool below to find specific information within the annual report.-
 1
1 -
2
-
3
-
4
-
5
-
6
-
7
-
8
-
9
-
10
-
11
-
12
-
13
-
14
-
15
-
16
-
17
-
18
-
19
-
20
-
21
-
22
-
23
-
24
-
25
-
26
-
27
-
28
-
29
-
30
-
31
-
32
-
33
-
34
-
35
-
36
-
37
-
38
-
39
-
40
-
41
-
42
-
43
-
 44
44 -
 45
45 -
 46
46 -
 47
47 -
 48
48 -
 49
49 -
 50
50 -
 51
51 -
 52
52 -
 53
53 -
 54
54 -
 55
55 -
 56
56 -
 57
57 -
 58
58 -
 59
59 -
 60
60 -
 61
61 -
 62
62 -
 63
63 -
 64
64 -
65
-
66
-
67
-
68
-
69
-
70
-
71
-
72
-
73
-
74
-
75
-
76
-
77
-
78
-
79
-
80
-
81
-
82
-
83
-
84
-
85
-
86
-
87
-
88
-
89
-
90
-
91
-
92
-
93
-
94
-
95
-
96
-
97
-
98
-
99
-
100
-
101
-
102
-
103
-
104
-
105
-
106
-
107
-
108
-
109
-
110
-
111
-
112
-
113
-
114
-
115
-
116
-
117
-
118
-
119
-
120
-
121
-
122
-
123
-
124
-
125
-
126
-
127
-
128
-
129
-
130
-
131
-
132
-
133
-
134
-
135
-
136
-
137
-
138
-
139
-
140
-
141
-
142
-
143
-
144
-
145
-
146
-
147
-
148
-
149
-
150
-
151
-
152
-
153
-
154
-
155
-
156
-
157
-
158
-
159
-
160
-
161
-
162
-
163
-
164
-
165
-
166
-
167
-
168
-
169
-
170
-
171
-
172
-
173
-
174
-
175
-
176
-
177
-
178
-
179
-
180
-
181
-
182
-
183
-
184
-
185
-
186
-
187
-
188
-
189
-
190
-
191
-
192
-
193
-
194
-
195
-
196
-
197
-
198
-
199
-
200
-
201
-
202
-
203
-
204
-
205
-
206
-
207
-
208
-
209
-
210
-
211
-
212
-
213
-
214
-
215
-
216
-
217
-
218
-
219
-
220
-
221
-
222
-
223
-
224
-
225
-
226
-
227
-
228
-
229
-
230
-
231
-
232
 |
 |

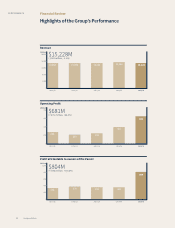
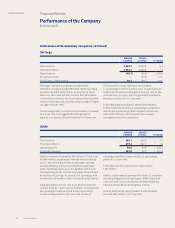
Financial Review
Operating Profit and Operating Profit Margin
Per Cent$ Million
600
500
400
300
200
100
0
8
6
4
2
0
2011/12 2012/13 2013/14 2014/15 2015/16
Operating Profit Margin (%) Operating Profit ($ Million)
Company Revenue and Expenditure
$ Million$ Million
15,000
12,000
9,000
6,000
3,000
0
15,000
12,000
9,000
6,000
3,000
0
2011/12 2012/13 2013/14 2014/15 2015/16
Revenue ($ Million) Expenditure ($ Million)
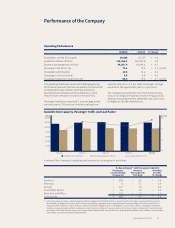
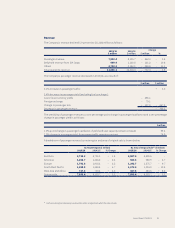
R4 The exceptional items in FY2014/15 pertained to provision for settlement with plaintis in the Transpacific Class Action ($11.4 million), partly oset by
additional gain on sale of Virgin Atlantic Limited ($7.3 million).
Operating Performance (continued)
Passenger load factor by route region was as follows:
Passenger Load Factor (%)
2015/16 2014/15
% Change
points
East Asia 77.3 76.1 + 1.2
Americas 79.8 79.6 + 0.2
Europe 78.7 79.6 – 0.9
South West Pacific 86.5 82.7 + 3.8
West Asia and Africa 74.8 72.2 + 2.6
Systemwide 79.6 78.5 + 1.1
Earnings
2015/16
$ million
2014/15
$ million % Change
Revenue 11,686.1 12,418.4 – 5.9
Expenditure 11,201.0 12,078.2 – 7.3
Operating profit 485.1 340.2 + 42.6
Finance charges (42.0) (44.0) – 4.5
Interest income 87.1 79.3 + 9.8
Surplus on disposal of aircraft, spares and spare engines 3.7 36.8 – 89.9
Dividends from subsidiary and associated companies 135.2 215.2 – 37.2
Dividends from long-term investments 95.2 4.9 n.m.
Other non-operating items 1.9 (65.2) n.m.
Profit before exceptional items 766.2 567.2 + 35.1
Exceptional items R4 –(4.1) n.m.
Profit before taxation 766.2 563.1 + 36.1
Taxation (94.2) (22.8) n.m.
Profit after taxation 672.0 540.3 + 24.4
n.m. not meaningful
Performance of the Company
(continued)
Singapore Airlines52
PERFORMANCE