Singapore Airlines 2016 Annual Report Download - page 6
Download and view the complete annual report
Please find page 6 of the 2016 Singapore Airlines annual report below. You can navigate through the pages in the report by either clicking on the pages listed below, or by using the keyword search tool below to find specific information within the annual report.-
 1
1 -
 2
2 -
 3
3 -
 4
4 -
 5
5 -
 6
6 -
 7
7 -
 8
8 -
 9
9 -
 10
10 -
 11
11 -
 12
12 -
 13
13 -
 14
14 -
 15
15 -
 16
16 -
 17
17 -
18
-
19
-
20
-
21
-
22
-
23
-
24
-
25
-
26
-
27
-
28
-
29
-
30
-
31
-
32
-
33
-
34
-
35
-
36
-
37
-
38
-
39
-
40
-
41
-
42
-
43
-
44
-
45
-
46
-
47
-
48
-
49
-
50
-
51
-
52
-
53
-
54
-
55
-
56
-
57
-
58
-
59
-
60
-
61
-
62
-
63
-
64
-
65
-
66
-
67
-
68
-
69
-
70
-
71
-
72
-
73
-
74
-
75
-
76
-
77
-
78
-
79
-
80
-
81
-
82
-
83
-
84
-
85
-
86
-
87
-
88
-
89
-
90
-
91
-
92
-
93
-
94
-
95
-
96
-
97
-
98
-
99
-
100
-
101
-
102
-
103
-
104
-
105
-
106
-
107
-
108
-
109
-
110
-
111
-
112
-
113
-
114
-
115
-
116
-
117
-
118
-
119
-
120
-
121
-
122
-
123
-
124
-
125
-
126
-
127
-
128
-
129
-
130
-
131
-
132
-
133
-
134
-
135
-
136
-
137
-
138
-
139
-
140
-
141
-
142
-
143
-
144
-
145
-
146
-
147
-
148
-
149
-
150
-
151
-
152
-
153
-
154
-
155
-
156
-
157
-
158
-
159
-
160
-
161
-
162
-
163
-
164
-
165
-
166
-
167
-
168
-
169
-
170
-
171
-
172
-
173
-
174
-
175
-
176
-
177
-
178
-
179
-
180
-
181
-
182
-
183
-
184
-
185
-
186
-
187
-
188
-
189
-
190
-
191
-
192
-
193
-
194
-
195
-
196
-
197
-
198
-
199
-
200
-
201
-
202
-
203
-
204
-
205
-
206
-
207
-
208
-
209
-
210
-
211
-
212
-
213
-
214
-
215
-
216
-
217
-
218
-
219
-
220
-
221
-
222
-
223
-
224
-
225
-
226
-
227
-
228
-
229
-
230
-
231
-
232
 |
 |

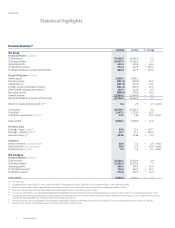
Statistical Highlights
Financial Statistics R1
2015/16 2014/15 % Change
The Group
Financial Results ($ million)
Total revenue 15,228.5 15,565.5 -2.2
Total expenditure 14,547.3 15,156.1 -4.0
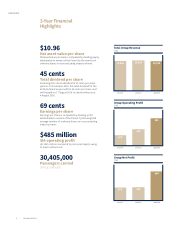
Operating profit 681.2 409.4 +66.4
Profit before taxation 972.4 442.9 +119.6
Profit attributable to owners of the Parent 804.4 367.9 +118.6
Financial Position ($ million)
Share capital 1,856.1 1,856.1 –
Treasury shares (381.5) (326.3) -16.9
Capital reserve (129.2) 215.9 n.m.
Foreign currency translation reserve (151.3) (135.7) -11.5
Share-based compensation reserve 123.7 113.2 +9.3
Fair value reserve (498.6) (706.2) + 29.4
General reserve 11,935.5 11,446.6 +4.3
Equity attributable to owners of the Parent 12,754.7 12,463.6 +2.3
Return on equity holders’ funds (%) R2 6.4 2.9 +3.5 points
Total assets 23,769.7 23,921.6 -0.6
Total debt 1,347.5 1,739.5 -22.5
Total debt : equity ratio (times) R3 0.11 0.14 -0.03 times
Value added 5,040.1 4,396.8 +14.6
Per Share Data
Earnings – basic (cents) R4 69.0 31.4 +119.7
Earnings – diluted (cents) R5 68.7 31.2 +120.2
Net asset value ($) R6 10.96 10.66 +2.8
Dividends
Interim dividend (cents per share) 10.0 5.0 +5.0 cents
Final dividend (cents per share) 35.0 17.0 +18.0 cents
Dividend cover (times) R7 1.5 1.4 +0.1 times
The Company
Financial Results ($ million)
Total revenue 11,686.1 12,418.4 -5.9
Total expenditure 11,201.0 12,078.2 -7.3
Operating profit 485.1 340.2 +42.6
Profit before taxation 766.2 563.1 +36.1
Profit aer taxation 672.0 540.3 +24.4
Value added 3,661.6 3,411.3 +7.3
n.m. not meaningful
R1 Singapore Airlines’ financial year is from 1 April to 31 March. Throughout this report, all figures are in Singapore Dollars, unless otherwise stated.
R2 Return on equity holders’ funds is profit attributable to owners of the Parent expressed as a percentage of the average equity holders’ funds.
R3 Total debt : equity ratio is total debt divided by equity attributable to owners of the Parent as at 31 March.
R4 Earnings per share (basic) is computed by dividing profit attributable to owners of the Parent by the weighted average number of ordinary shares in issue excluding treasury shares.
R5 Earnings per share (diluted) is computed by dividing profit attributable to owners of the Parent by the weighted average number of ordinary shares in issue excluding treasury shares,
adjusted for the dilutive eect on the exercise of all outstanding share options.
R6 Net asset value per share is computed by dividing equity attributable to owners of the Parent by the number of ordinary shares in issue excluding treasury shares at 31 March.
R7 Dividend cover is profit attributable to owners of the Parent divided by total dividends.
Singapore Airlines4
OVERVIEW