Singapore Airlines 2016 Annual Report Download - page 139
Download and view the complete annual report
Please find page 139 of the 2016 Singapore Airlines annual report below. You can navigate through the pages in the report by either clicking on the pages listed below, or by using the keyword search tool below to find specific information within the annual report.-
 1
1 -
2
-
3
-
4
-
5
-
6
-
7
-
8
-
9
-
10
-
11
-
12
-
13
-
14
-
15
-
16
-
17
-
18
-
19
-
20
-
21
-
22
-
23
-
24
-
25
-
26
-
27
-
28
-
29
-
30
-
31
-
32
-
33
-
34
-
35
-
36
-
37
-
38
-
39
-
40
-
41
-
42
-
43
-
44
-
45
-
46
-
47
-
48
-
49
-
50
-
51
-
52
-
53
-
54
-
55
-
56
-
57
-
58
-
59
-
60
-
61
-
62
-
63
-
64
-
65
-
66
-
67
-
68
-
69
-
70
-
71
-
72
-
73
-
74
-
75
-
76
-
77
-
78
-
79
-
80
-
81
-
82
-
83
-
84
-
85
-
86
-
87
-
88
-
89
-
90
-
91
-
92
-
93
-
94
-
95
-
96
-
97
-
98
-
99
-
100
-
101
-
102
-
103
-
104
-
105
-
106
-
107
-
108
-
109
-
110
-
111
-
112
-
113
-
114
-
115
-
116
-
117
-
118
-
119
-
120
-
121
-
122
-
123
-
124
-
125
-
126
-
127
-
128
-
 129
129 -
 130
130 -
 131
131 -
 132
132 -
 133
133 -
 134
134 -
 135
135 -
 136
136 -
 137
137 -
 138
138 -
 139
139 -
 140
140 -
 141
141 -
 142
142 -
 143
143 -
 144
144 -
 145
145 -
 146
146 -
 147
147 -
 148
148 -
 149
149 -
150
-
151
-
152
-
153
-
154
-
155
-
156
-
157
-
158
-
159
-
160
-
161
-
162
-
163
-
164
-
165
-
166
-
167
-
168
-
169
-
170
-
171
-
172
-
173
-
174
-
175
-
176
-
177
-
178
-
179
-
180
-
181
-
182
-
183
-
184
-
185
-
186
-
187
-
188
-
189
-
190
-
191
-
192
-
193
-
194
-
195
-
196
-
197
-
198
-
199
-
200
-
201
-
202
-
203
-
204
-
205
-
206
-
207
-
208
-
209
-
210
-
211
-
212
-
213
-
214
-
215
-
216
-
217
-
218
-
219
-
220
-
221
-
222
-
223
-
224
-
225
-
226
-
227
-
228
-
229
-
230
-
231
-
232
 |
 |

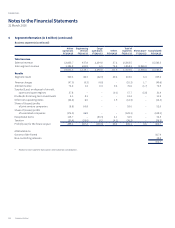
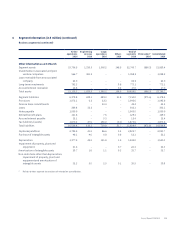
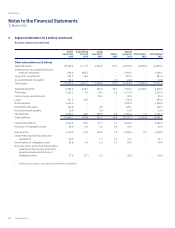
4 Segment Information (in $ million) (continued)
Business segments
The Group’s business is organised and managed separately according to the nature of the services provided. The following table presents revenue
and profit information regarding business segments for the financial years ended 31 March 2016 and 2015 and certain assets and liabilities
information of the business segments as at those dates.
Airline
operations
Engineering
services
Cargo
operations Others
Total of
segments Elimination* Consolidated
FY2015/16 FY2015/16 FY2015/16 FY2015/16 FY2015/16 FY2015/16 FY2015/16
Total Revenue
External revenue 12,775.0 395.8 2,037.1 20.6 15,228.5 – 15,228.5
Inter-segment revenue 1,084.4 717.7 7.9 58.5 1,868.5 (1,868.5) –
13,859.4 1,113.5 2,045.0 79.1 17,097.0 (1,868.5) 15,228.5
Results
Segment result 623.3 104.1 (49.7) (2.1) 675.6 5.6 681.2
Finance charges (51.4) (0.3) (1.4) – (53.1) 2.8 (50.3)
Interest income 67.8 2.1 3.3 0.3 73.5 (2.8) 70.7
Surplus/(Loss) on disposal of aircraft,
spares and spare engines 40.2 – 13.5 (1.0) 52.7 – 52.7
Dividends from long-term investments 109.2 6.1 – – 115.3 – 115.3
Other non-operating items (21.0) (4.5) 116.5 0.1 91.1 – 91.1
Share of (losses)/profits
of joint venture companies (21.0) 43.8 – – 22.8 – 22.8
Share of (losses)/profits
of associated companies (60.1) 49.0 – – (11.1) – (11.1)
Taxation (110.9) (20.8) 5.5 5.6 (120.6) – (120.6)
Profit for the financial year 576.1 179.5 87.7 2.9 846.2 5.6 851.8
Attributable to:
Owners of the Parent 804.4
Non-controlling interests 47.4
851.8
* Relates to inter-segment transactions eliminated on consolidation.
Annual Report FY2015/16 137