Singapore Airlines 2016 Annual Report Download - page 194
Download and view the complete annual report
Please find page 194 of the 2016 Singapore Airlines annual report below. You can navigate through the pages in the report by either clicking on the pages listed below, or by using the keyword search tool below to find specific information within the annual report.-
 1
1 -
2
-
3
-
4
-
5
-
6
-
7
-
8
-
9
-
10
-
11
-
12
-
13
-
14
-
15
-
16
-
17
-
18
-
19
-
20
-
21
-
22
-
23
-
24
-
25
-
26
-
27
-
28
-
29
-
30
-
31
-
32
-
33
-
34
-
35
-
36
-
37
-
38
-
39
-
40
-
41
-
42
-
43
-
44
-
45
-
46
-
47
-
48
-
49
-
50
-
51
-
52
-
53
-
54
-
55
-
56
-
57
-
58
-
59
-
60
-
61
-
62
-
63
-
64
-
65
-
66
-
67
-
68
-
69
-
70
-
71
-
72
-
73
-
74
-
75
-
76
-
77
-
78
-
79
-
80
-
81
-
82
-
83
-
84
-
85
-
86
-
87
-
88
-
89
-
90
-
91
-
92
-
93
-
94
-
95
-
96
-
97
-
98
-
99
-
100
-
101
-
102
-
103
-
104
-
105
-
106
-
107
-
108
-
109
-
110
-
111
-
112
-
113
-
114
-
115
-
116
-
117
-
118
-
119
-
120
-
121
-
122
-
123
-
124
-
125
-
126
-
127
-
128
-
129
-
130
-
131
-
132
-
133
-
134
-
135
-
136
-
137
-
138
-
139
-
140
-
141
-
142
-
143
-
144
-
145
-
146
-
147
-
148
-
149
-
150
-
151
-
152
-
153
-
154
-
155
-
156
-
157
-
158
-
159
-
160
-
161
-
162
-
163
-
164
-
165
-
166
-
167
-
168
-
169
-
170
-
171
-
172
-
173
-
174
-
175
-
176
-
177
-
178
-
179
-
180
-
181
-
182
-
183
-
 184
184 -
 185
185 -
 186
186 -
 187
187 -
 188
188 -
 189
189 -
 190
190 -
 191
191 -
 192
192 -
 193
193 -
 194
194 -
 195
195 -
 196
196 -
 197
197 -
 198
198 -
 199
199 -
 200
200 -
 201
201 -
 202
202 -
 203
203 -
 204
204 -
205
-
206
-
207
-
208
-
209
-
210
-
211
-
212
-
213
-
214
-
215
-
216
-
217
-
218
-
219
-
220
-
221
-
222
-
223
-
224
-
225
-
226
-
227
-
228
-
229
-
230
-
231
-
232
 |
 |

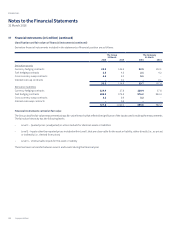
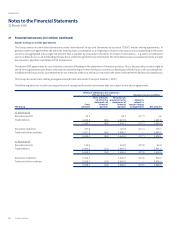
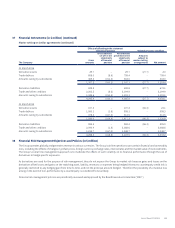
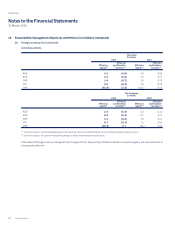
Notes to the Financial Statements
31 March 2016
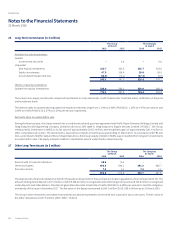
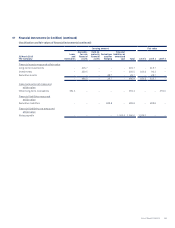
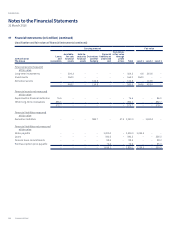
37 Financial Instruments (in $ million)
Classification and fair values of financial instruments
Financial assets and financial liabilities are measured on an ongoing basis either at fair value or at amortised cost. The principal accounting
policies in Note 2 describe how the classes of financial instruments are measured, and how revenue and expenses, including fair value gains
and losses, are recognised.
The carrying amounts and fair values of financial assets and financial liabilities, including their levels in the fair value hierarchy are as follows.
It does not include fair value information for financial assets and financial liabilities not measured at fair value if the carrying amount is a
reasonable approximation of fair value.
The classifications of financial assets that are not measured at fair value and have carrying amounts which are a reasonable approximation of
fair value, are as follows:
• Loanreceivablefromanassociatedcompany,tradedebtors,amountsowingbysubsidiarycompanies,depositsandotherdebtors,and
cash and bank balances are classified as loans and receivables financial assets; and
• Quotednon-equityinvestmentsareclassifiedasheld-to-maturityfinancialassets.
All financial liabilities that are not measured at fair value and have carrying amounts which are a reasonable approximation of fair value are
classified as financial liabilities at amortised cost.
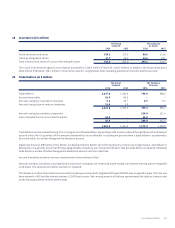
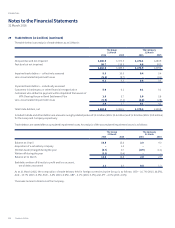
Carrying amount Fair value
31 March 2016
The Group
Loans
and
receivables
Available-
for-sale
financial
assets
Held-to-
maturity
financial
assets
Derivatives
used for
hedging
Financial
liabilities at
amortised
cost Total Level 1 Level 2 Level 3
Financial assets measured at fair value
Long-term investments – 215.7 – – – 215.7 – 215.7 –
Investments – 316.7 – – – 316.7 226.4 90.3 –
Derivative assets – – – 32.3 – 32.3 – 32.3 –
Assets held for sale – 156.5 – – – 156.5 – 156.5 –
– 688.9 – 32.3 – 721.2 226.4 494.8 –
Financial assets not measured
at fair value
Deposit with a financial institution 79.4 – – – – 79.4 – – 84.1
Other long-term receivables 460.8 – – – – 460.8 – – 457.9
540.2 – – – – 540.2 – – 542.0
Financial liabilities measured
at fair value
Derivative liabilities – – – 727.8 – 727.8 – 727.8 –
Financial liabilities not measured
at fair value
Notes payable – – – – 1,000.0 1,000.0 1,036.3 – –
Loans – – – – 303.1 303.1 – – 320.5
Finance lease commitments – – – – 44.4 44.4 – – 44.4
Purchase option price payable – – – – 79.4 79.4 – – 83.8
– – – – 1,426.9 1,426.9 1,036.3 – 448.7
Singapore Airlines192
FINANCIAL