Singapore Airlines 2016 Annual Report Download - page 201
Download and view the complete annual report
Please find page 201 of the 2016 Singapore Airlines annual report below. You can navigate through the pages in the report by either clicking on the pages listed below, or by using the keyword search tool below to find specific information within the annual report.-
 1
1 -
2
-
3
-
4
-
5
-
6
-
7
-
8
-
9
-
10
-
11
-
12
-
13
-
14
-
15
-
16
-
17
-
18
-
19
-
20
-
21
-
22
-
23
-
24
-
25
-
26
-
27
-
28
-
29
-
30
-
31
-
32
-
33
-
34
-
35
-
36
-
37
-
38
-
39
-
40
-
41
-
42
-
43
-
44
-
45
-
46
-
47
-
48
-
49
-
50
-
51
-
52
-
53
-
54
-
55
-
56
-
57
-
58
-
59
-
60
-
61
-
62
-
63
-
64
-
65
-
66
-
67
-
68
-
69
-
70
-
71
-
72
-
73
-
74
-
75
-
76
-
77
-
78
-
79
-
80
-
81
-
82
-
83
-
84
-
85
-
86
-
87
-
88
-
89
-
90
-
91
-
92
-
93
-
94
-
95
-
96
-
97
-
98
-
99
-
100
-
101
-
102
-
103
-
104
-
105
-
106
-
107
-
108
-
109
-
110
-
111
-
112
-
113
-
114
-
115
-
116
-
117
-
118
-
119
-
120
-
121
-
122
-
123
-
124
-
125
-
126
-
127
-
128
-
129
-
130
-
131
-
132
-
133
-
134
-
135
-
136
-
137
-
138
-
139
-
140
-
141
-
142
-
143
-
144
-
145
-
146
-
147
-
148
-
149
-
150
-
151
-
152
-
153
-
154
-
155
-
156
-
157
-
158
-
159
-
160
-
161
-
162
-
163
-
164
-
165
-
166
-
167
-
168
-
169
-
170
-
171
-
172
-
173
-
174
-
175
-
176
-
177
-
178
-
179
-
180
-
181
-
182
-
183
-
184
-
185
-
186
-
187
-
188
-
189
-
190
-
 191
191 -
 192
192 -
 193
193 -
 194
194 -
 195
195 -
 196
196 -
 197
197 -
 198
198 -
 199
199 -
 200
200 -
 201
201 -
 202
202 -
 203
203 -
 204
204 -
 205
205 -
 206
206 -
 207
207 -
 208
208 -
 209
209 -
 210
210 -
 211
211 -
212
-
213
-
214
-
215
-
216
-
217
-
218
-
219
-
220
-
221
-
222
-
223
-
224
-
225
-
226
-
227
-
228
-
229
-
230
-
231
-
232
 |
 |

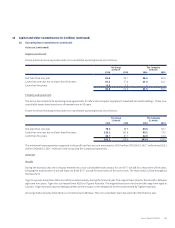
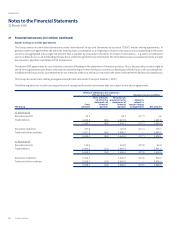
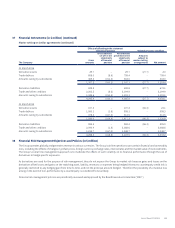
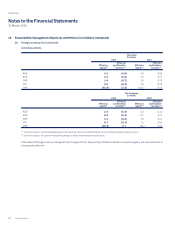
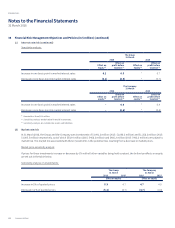
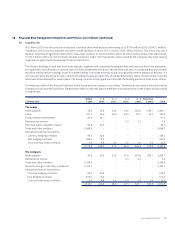
37 Financial Instruments (in $ million) (continued)
Master netting or similar agreements (continued)
Effects of offsetting in the statement
of financial position Related amounts not offset
The Company
Gross
amounts
Gross amounts
set-off in the
statements
of financial
position
Net amounts
presented in the
statements
of financial
position
Amounts
subject to
master netting
arrangements Net amount
31 March 2016
Derivative assets 29.7 – 29.7 (27.7) 2.0
Trade debtors 808.0 (8.6) 799.4 – 799.4
Amounts owing by subsidiaries 469.5 (151.5) 318.0 – 318.0
1,307.2 (160.1) 1,147.1 (27.7) 1,119.4
Derivative liabilities 699.8 – 699.8 (27.7) 672.1
Trade and other creditors 2,203.5 (8.6) 2,194.9 – 2,194.9
Amounts owing to subsidiaries 1,342.6 (151.5) 1,191.1 – 1,191.1
4,245.9 (160.1) 4,085.8 (27.7) 4,058.1
31 March 2015
Derivative assets 107.4 – 107.4 (86.3) 21.1
Trade debtors 1,000.1 (1.8) 998.3 – 998.3
Amounts owing by subsidiaries 478.5 (167.0) 311.5 – 311.5
1,586.0 (168.8) 1,417.2 (86.3) 1,330.9
Derivative liabilities 982.2 – 982.2 (86.3) 895.9
Trade and other creditors 2,090.4 (1.8) 2,088.6 – 2,088.6
Amounts owing to subsidiaries 1,215.7 (167.0) 1,048.7 – 1,048.7
4,288.3 (168.8) 4,119.5 (86.3) 4,033.2
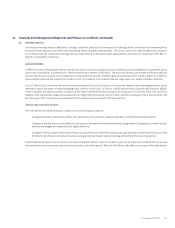
38 Financial Risk Management Objectives and Policies (in $ million)
The Group operates globally and generates revenue in various currencies. The Group’s airline operations carry certain financial and commodity
risks, including the eects of changes in jet fuel prices, foreign currency exchange rates, interest rates and the market value of its investments.
The Group’s overall risk management approach is to moderate the eects of such volatility on its financial performance through the use of
derivatives to hedge specific exposures.
As derivatives are used for the purpose of risk management, they do not expose the Group to market risk because gains and losses on the
derivatives oset losses and gains on the matching asset, liability, revenues or expenses being hedged. Moreover, counterparty credit risk is
generally restricted to any hedging gain from time to time, and not the principal amount hedged. Therefore the possibility of a material loss
arising in the event of non-performance by a counterparty is considered to be unlikely.
Financial risk management policies are periodically reviewed and approved by the Board Executive Committee (“BEC”).
Annual Report FY2015/16 199