Singapore Airlines 2016 Annual Report Download - page 218
Download and view the complete annual report
Please find page 218 of the 2016 Singapore Airlines annual report below. You can navigate through the pages in the report by either clicking on the pages listed below, or by using the keyword search tool below to find specific information within the annual report.-
 1
1 -
2
-
3
-
4
-
5
-
6
-
7
-
8
-
9
-
10
-
11
-
12
-
13
-
14
-
15
-
16
-
17
-
18
-
19
-
20
-
21
-
22
-
23
-
24
-
25
-
26
-
27
-
28
-
29
-
30
-
31
-
32
-
33
-
34
-
35
-
36
-
37
-
38
-
39
-
40
-
41
-
42
-
43
-
44
-
45
-
46
-
47
-
48
-
49
-
50
-
51
-
52
-
53
-
54
-
55
-
56
-
57
-
58
-
59
-
60
-
61
-
62
-
63
-
64
-
65
-
66
-
67
-
68
-
69
-
70
-
71
-
72
-
73
-
74
-
75
-
76
-
77
-
78
-
79
-
80
-
81
-
82
-
83
-
84
-
85
-
86
-
87
-
88
-
89
-
90
-
91
-
92
-
93
-
94
-
95
-
96
-
97
-
98
-
99
-
100
-
101
-
102
-
103
-
104
-
105
-
106
-
107
-
108
-
109
-
110
-
111
-
112
-
113
-
114
-
115
-
116
-
117
-
118
-
119
-
120
-
121
-
122
-
123
-
124
-
125
-
126
-
127
-
128
-
129
-
130
-
131
-
132
-
133
-
134
-
135
-
136
-
137
-
138
-
139
-
140
-
141
-
142
-
143
-
144
-
145
-
146
-
147
-
148
-
149
-
150
-
151
-
152
-
153
-
154
-
155
-
156
-
157
-
158
-
159
-
160
-
161
-
162
-
163
-
164
-
165
-
166
-
167
-
168
-
169
-
170
-
171
-
172
-
173
-
174
-
175
-
176
-
177
-
178
-
179
-
180
-
181
-
182
-
183
-
184
-
185
-
186
-
187
-
188
-
189
-
190
-
191
-
192
-
193
-
194
-
195
-
196
-
197
-
198
-
199
-
200
-
201
-
202
-
203
-
204
-
205
-
206
-
207
-
 208
208 -
 209
209 -
 210
210 -
 211
211 -
 212
212 -
 213
213 -
 214
214 -
 215
215 -
 216
216 -
 217
217 -
 218
218 -
 219
219 -
 220
220 -
 221
221 -
 222
222 -
 223
223 -
 224
224 -
 225
225 -
 226
226 -
 227
227 -
 228
228 -
229
-
230
-
231
-
232
 |
 |

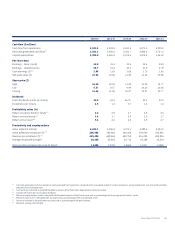
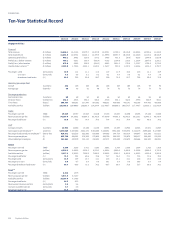
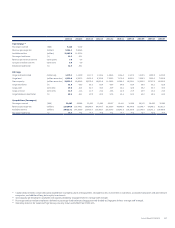
Ten-Year Statistical Record
2015/16 2014/15 2013/14 2012/13 2011/12 2010/11 2009/10 2008/09 2007/08 2006/07
Singapore Airlines
Financial
Total revenue ($ million) 11,686.1 12,418.4 12,479.7 12,387.0 12,070.1 11,739.1 10,145.0 13,049.5 12,759.6 11,343.9
Total expenditure ($ million) 11,201.0 12,078.2 12,224.1 12,199.8 11,889.5 10,887.8 10,183.6 12,226.6 11,115.6 10,316.9
Operating profit/(loss) ($ million) 485.1 340.2 255.6 187.2 180.6 851.3 (38.6) 822.9 1,644.0 1,027.0
Profit/(Loss) before taxation ($ million) 766.2 563.1 536.4 (682.4) 413.3 1,194.0 233.3 1,252.4 2,077.6 2,291.1
Profit/(Loss) after taxation ($ million) 672.0 540.3 538.5 (694.1) 390.2 1,011.2 279.8 1,218.7 1,758.8 2,213.2
Capital disbursements R1 ($ million) 2,309.0 1,788.5 2,251.1 1,648.2 1,762.7 981.9 1,372.4 1,698.6 1,814.4 2,792.7
Passenger - yield (cents/pkm) 10.6 11.2 11.1 11.4 11.8 11.9 10.4 12.5 12.1 10.9
- unit cost (cents/ask) 8.5 8.9 9.1 9.2 9.2 8.9 8.6 9.2 8.4 7.9
- breakeven load factor (%) 80.2 79.5 82.0 80.7 78.0 74.8 82.7 73.6 69.4 72.5
Operating passenger fleet
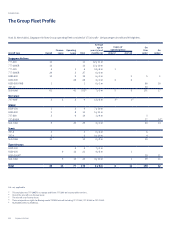
Aircraft (numbers) 102 105 103 101 100 108 108 103 98 94
Average age (months) 89 85 81 80 74 75 75 74 77 75
Passenger production
Destination cities (numbers) 60 60 62 63 63 64 68 66 65 64
Distance flown (million km) 382.3 384.4 392.2 386.3 374.6 354.1 342.4 379.8 365.9 353.1
Time flown (hours) 506,757 508,591 517,987 507,562 490,261 460,096 443,141 492,103 474,432 458,936
Available seat-km (million) 118,366.5 120,000.8 120,502.8 118,264.4 113,409.7 108,060.2 105,673.7 117,788.7 113,919.1 112,543.8
Traffic
Passengers carried (‘000) 19,029 18,737 18,628 18,210 17,155 16,647 16,480 18,293 19,120 18,346
Revenue passenger-km (million) 94,267.4 94,209.2 95,064.3 93,765.6 87,824.0 84,801.3 82,882.5 90,128.1 91,485.2 89,148.8
Passenger load factor (%) 79.6 78.5 78.9 79.3 77.4 78.5 78.4 76.5 80.3 79.2
Staff
Average strength (numbers) 13,983 14,040 14,240 14,156 13,893 13,588 13,934 14,343 14,071 13,847
Seat capacity per employee R2 (seat-km) 8,465,029 8,547,066 8,462,275 8,354,366 8,163,082 7,952,620 7,583,874 8,212,278 8,096,020 8,127,667
Passenger load carried per employee R3 (tonne-km) 626,572 625,516 625,995 619,969 594,663 588,714 563,318 598,047 618,295 613,211
Revenue per employee ($) 835,736 884,501 876,383 875,035 868,790 863,931 728,075 909,817 906,801 819,232
Value added per employee ($) 261,861 242,970 242,184 159,593 237,472 310,480 219,678 294,666 368,382 368,831
SilkAir
Passengers carried (‘000) 3,836 3,553 3,411 3,295 3,032 2,764 2,356 1,954 1,815 1,616
Revenue passenger-km (million) 6,516.2 5,864.9 5,516.1 5,223.1 4,469.4 4,039.6 3,466.4 3,158.6 3,094.9 2,712.9
Available seat-km (million) 9,117.8 8,355.2 7,926.9 7,096.3 5,904.8 5,285.1 4,495.9 4,355.2 4,323.0 3,865.8
Passenger load factor (%) 71.5 70.2 69.6 73.6 75.7 76.4 77.1 72.5 71.6 70.2
Passenger yield (cents/pkm) 13.5 13.9 13.7 14.1 14.5 14.1 13.1 15.0 14.0 13.4
Passenger unit cost (cents/ask) 9.0 9.7 9.8 9.9 10.1 9.4 9.9 10.9 9.7 9.4
Passenger breakeven load factor (%) 66.7 69.8 71.5 70.2 69.7 66.7 75.6 72.7 69.3 70.1
Scoot R4
Passengers carried (‘000) 2,412 1,878
Revenue passenger-km (million) 8,673.9 6,718.7
Available seat-km (million) 10,267.4 8,170.6
Passenger load factor (%) 84.5 82.2
Revenue per revenue seat-km (cents/pkm) 5.6 5.6
Cost per available seat-km (cents/ask) 4.7 5.8
Breakeven load factor (%) 83.9 103.6
Singapore Airlines216
FINANCIAL