Singapore Airlines 2016 Annual Report Download - page 215
Download and view the complete annual report
Please find page 215 of the 2016 Singapore Airlines annual report below. You can navigate through the pages in the report by either clicking on the pages listed below, or by using the keyword search tool below to find specific information within the annual report.-
 1
1 -
2
-
3
-
4
-
5
-
6
-
7
-
8
-
9
-
10
-
11
-
12
-
13
-
14
-
15
-
16
-
17
-
18
-
19
-
20
-
21
-
22
-
23
-
24
-
25
-
26
-
27
-
28
-
29
-
30
-
31
-
32
-
33
-
34
-
35
-
36
-
37
-
38
-
39
-
40
-
41
-
42
-
43
-
44
-
45
-
46
-
47
-
48
-
49
-
50
-
51
-
52
-
53
-
54
-
55
-
56
-
57
-
58
-
59
-
60
-
61
-
62
-
63
-
64
-
65
-
66
-
67
-
68
-
69
-
70
-
71
-
72
-
73
-
74
-
75
-
76
-
77
-
78
-
79
-
80
-
81
-
82
-
83
-
84
-
85
-
86
-
87
-
88
-
89
-
90
-
91
-
92
-
93
-
94
-
95
-
96
-
97
-
98
-
99
-
100
-
101
-
102
-
103
-
104
-
105
-
106
-
107
-
108
-
109
-
110
-
111
-
112
-
113
-
114
-
115
-
116
-
117
-
118
-
119
-
120
-
121
-
122
-
123
-
124
-
125
-
126
-
127
-
128
-
129
-
130
-
131
-
132
-
133
-
134
-
135
-
136
-
137
-
138
-
139
-
140
-
141
-
142
-
143
-
144
-
145
-
146
-
147
-
148
-
149
-
150
-
151
-
152
-
153
-
154
-
155
-
156
-
157
-
158
-
159
-
160
-
161
-
162
-
163
-
164
-
165
-
166
-
167
-
168
-
169
-
170
-
171
-
172
-
173
-
174
-
175
-
176
-
177
-
178
-
179
-
180
-
181
-
182
-
183
-
184
-
185
-
186
-
187
-
188
-
189
-
190
-
191
-
192
-
193
-
194
-
195
-
196
-
197
-
198
-
199
-
200
-
201
-
202
-
203
-
204
-
 205
205 -
 206
206 -
 207
207 -
 208
208 -
 209
209 -
 210
210 -
 211
211 -
 212
212 -
 213
213 -
 214
214 -
 215
215 -
 216
216 -
 217
217 -
 218
218 -
 219
219 -
 220
220 -
 221
221 -
 222
222 -
 223
223 -
 224
224 -
 225
225 -
226
-
227
-
228
-
229
-
230
-
231
-
232
 |
 |

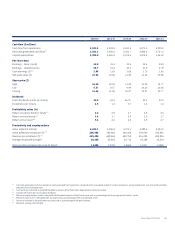
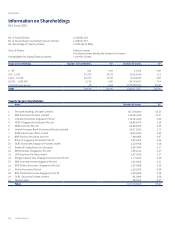
Quarterly Results of the Group
1st Quarter 2nd Quarter 3rd Quarter 4th Quarter Total
Total revenue
2015/16 ($ million) 3,733.3 3,844.8 3,941.0 3,709.4 15,228.5
2014/15 ($ million) 3,682.2 3,905.1 4,098.5 3,879.7 15,565.5
Total expenditure
2015/16 ($ million) 3,621.9 3,716.2 3,653.0 3,556.2 14,547.3
2014/15 ($ million) 3,642.7 3,773.4 3,952.2 3,787.8 15,156.1
Operating profit
2015/16 ($ million) 111.4 128.6 288.0 153.2 681.2
2014/15 ($ million) 39.5 131.7 146.3 91.9 409.4
Profit before taxation
2015/16 ($ million) 126.5 239.8 362.9 243.2 972.4
2014/15 ($ million) 60.5 86.0 239.8 56.6 442.9
Profit attributable to owners of the Parent
2015/16 ($ million) 91.2 213.6 274.9 224.7 804.4
2014/15 ($ million) 34.8 90.9 202.6 39.6 367.9
Earnings per share – Basic
2015/16 (cents) 7.8 18.3 23.6 19.3 69.0
2014/15 (cents) 3.0 7.7 17.3 3.4 31.4
Earnings per share – Diluted
2015/16 (cents) 7.8 18.2 23.5 19.2 68.7
2014/15 (cents) 2.9 7.7 17.2 3.4 31.2
Annual Report FY2015/16 213