Singapore Airlines 2016 Annual Report Download - page 187
Download and view the complete annual report
Please find page 187 of the 2016 Singapore Airlines annual report below. You can navigate through the pages in the report by either clicking on the pages listed below, or by using the keyword search tool below to find specific information within the annual report.-
 1
1 -
2
-
3
-
4
-
5
-
6
-
7
-
8
-
9
-
10
-
11
-
12
-
13
-
14
-
15
-
16
-
17
-
18
-
19
-
20
-
21
-
22
-
23
-
24
-
25
-
26
-
27
-
28
-
29
-
30
-
31
-
32
-
33
-
34
-
35
-
36
-
37
-
38
-
39
-
40
-
41
-
42
-
43
-
44
-
45
-
46
-
47
-
48
-
49
-
50
-
51
-
52
-
53
-
54
-
55
-
56
-
57
-
58
-
59
-
60
-
61
-
62
-
63
-
64
-
65
-
66
-
67
-
68
-
69
-
70
-
71
-
72
-
73
-
74
-
75
-
76
-
77
-
78
-
79
-
80
-
81
-
82
-
83
-
84
-
85
-
86
-
87
-
88
-
89
-
90
-
91
-
92
-
93
-
94
-
95
-
96
-
97
-
98
-
99
-
100
-
101
-
102
-
103
-
104
-
105
-
106
-
107
-
108
-
109
-
110
-
111
-
112
-
113
-
114
-
115
-
116
-
117
-
118
-
119
-
120
-
121
-
122
-
123
-
124
-
125
-
126
-
127
-
128
-
129
-
130
-
131
-
132
-
133
-
134
-
135
-
136
-
137
-
138
-
139
-
140
-
141
-
142
-
143
-
144
-
145
-
146
-
147
-
148
-
149
-
150
-
151
-
152
-
153
-
154
-
155
-
156
-
157
-
158
-
159
-
160
-
161
-
162
-
163
-
164
-
165
-
166
-
167
-
168
-
169
-
170
-
171
-
172
-
173
-
174
-
175
-
176
-
 177
177 -
 178
178 -
 179
179 -
 180
180 -
 181
181 -
 182
182 -
 183
183 -
 184
184 -
 185
185 -
 186
186 -
 187
187 -
 188
188 -
 189
189 -
 190
190 -
 191
191 -
 192
192 -
 193
193 -
 194
194 -
 195
195 -
 196
196 -
 197
197 -
198
-
199
-
200
-
201
-
202
-
203
-
204
-
205
-
206
-
207
-
208
-
209
-
210
-
211
-
212
-
213
-
214
-
215
-
216
-
217
-
218
-
219
-
220
-
221
-
222
-
223
-
224
-
225
-
226
-
227
-
228
-
229
-
230
-
231
-
232
 |
 |

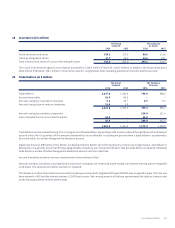
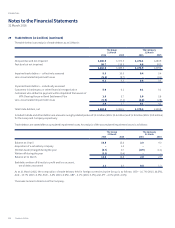
30 Deposits and Other Debtors (in $ million)
The Group
31 March
The Company
31 March
2016 2015 2016 2015
Deposits 15.9 15.5 8.5 8.4
Other debtors 98.9 23.3 35.0 9.5
114.8 38.8 43.5 17.9
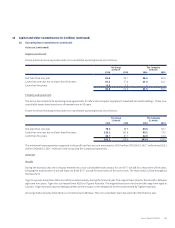
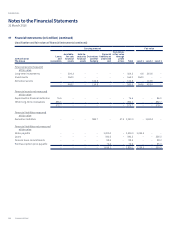
31 Investments (in $ million)
The Group
31 March
The Company
31 March
2016 2015 2016 2015
Available-for-sale investments
Quoted
Government securities 16.4 8.0 0.5 –
Equity investments 33.5 37.7 – –
Non-equity investments 176.5 118.3 159.7 98.1
226.4 164.0 160.2 98.1
Unquoted
Non-equity investments 90.3 – 90.3 –
316.7 164.0 250.5 98.1
Held-to-maturity investments
Quoted non-equity investments 351.4 4.6 351.4 4.6
668.1 168.6 601.9 102.7
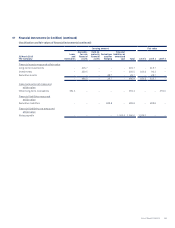
The Group’s non-equity investments comprised investments in government securities, corporate bonds, credit-linked notes and money market
funds. These investments are held to manage the Group’s liquidity needs.
The interest rates for quoted government securities range from 1.12% to 5.25% (FY2014/15: 0.76% to 4.63%) per annum. The interest rates for
quoted non-equity investments range from 1.25% to 4.47% (FY2014/15: 1.30% to 4.47%) per annum.
Annual Report FY2015/16 185