Office Depot 2011 Annual Report Download - page 80
Download and view the complete annual report
Please find page 80 of the 2011 Office Depot annual report below. You can navigate through the pages in the report by either clicking on the pages listed below, or by using the keyword search tool below to find specific information within the annual report.-
 1
1 -
2
-
3
-
4
-
5
-
6
-
7
-
8
-
9
-
10
-
11
-
12
-
13
-
14
-
15
-
16
-
17
-
18
-
19
-
20
-
21
-
22
-
23
-
24
-
25
-
26
-
27
-
28
-
29
-
30
-
31
-
32
-
33
-
34
-
35
-
36
-
37
-
38
-
39
-
40
-
41
-
42
-
43
-
44
-
45
-
46
-
47
-
48
-
49
-
50
-
51
-
52
-
53
-
54
-
55
-
56
-
57
-
58
-
59
-
60
-
61
-
62
-
63
-
64
-
65
-
66
-
67
-
68
-
69
-
 70
70 -
 71
71 -
 72
72 -
 73
73 -
 74
74 -
 75
75 -
 76
76 -
 77
77 -
 78
78 -
 79
79 -
 80
80 -
 81
81 -
 82
82 -
 83
83 -
 84
84 -
 85
85 -
 86
86 -
 87
87 -
 88
88 -
 89
89 -
 90
90 -
91
-
92
-
93
-
94
-
95
-
96
-
97
-
98
-
99
-
100
-
101
-
102
-
103
-
104
-
105
-
106
-
107
-
108
-
109
-
110
-
111
-
112
-
113
-
114
-
115
-
116
-
117
-
118
-
119
-
120
-
121
-
122
-
123
-
124
-
125
-
126
-
127
-
128
-
129
-
130
-
131
-
132
-
133
-
134
-
135
-
136
-
137
-
138
-
139
-
140
-
141
-
142
-
143
-
144
-
145
-
146
-
147
-
148
-
149
-
150
-
151
-
152
-
153
-
154
-
155
-
156
-
157
-
158
-
159
-
160
-
161
-
162
-
163
-
164
-
165
-
166
-
167
-
168
-
169
-
170
-
171
-
172
-
173
-
174
-
175
-
176
-
177
-
178
-
179
-
180
-
181
-
182
-
183
-
184
-
185
-
186
-
187
-
188
-
189
-
190
-
191
-
192
-
193
-
194
-
195
-
196
-
197
-
198
-
199
-
200
-
201
-
202
-
203
-
204
-
205
-
206
-
207
-
208
-
209
-
210
-
211
-
212
-
213
-
214
-
215
-
216
-
217
-
218
-
219
-
220
-
221
-
222
-
223
-
224
-
225
-
226
-
227
-
228
-
229
-
230
-
231
-
232
-
233
-
234
-
235
-
236
-
237
-
238
-
239
-
240
 |
 |

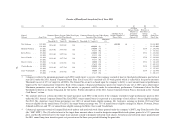
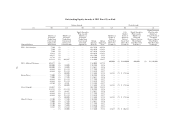
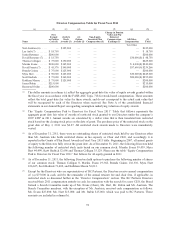
Director Compensation Table for Fiscal Year 2011
(a) (b) (c) (d) (e) (f) (g) (h)
Name
Fees
Earned
or Paid in
Cash ($)
(1)(2)(3)
Stock
Awards ($)
(4)
Option
Awards ($)
Non-Equity
Incentive Plan
Compensation ($)
Change in Pension
Value and NQ
Deferred
Compensation
Earnings ($)
All Other
Compensation
(5)
Total
Total Other
Neil Austrian (6) .... — $125,000 — — — — $125,000
Lee Ault (7) ........ $ 18,750 — — — — — $ 18,750
Justin Bateman ...... $200,000 — — — — — $200,000
David Bernauer (7) . . . $ 18,750 — — — — $30,000 (8) $ 48,750
Thomas Colligan .... $ 75,000 $150,000 — — — — $225,000
Marsha Evans ....... $100,000 $145,000 — — — $ 4,000 (8) $249,000
David Fuente (7) .... $ 41,576 $140,000 — — — $57,690 (9) $239,266
Brenda Gaines ...... $ 75,000 $125,000 — — — — $200,000
Myra Hart .......... $ 90,000 $125,000 — — — $30,000 (8) $245,000
Scott Hedrick ....... $ 75,000 $160,000 — — — $20,000 (8) $255,000
Kathleen Mason ..... $ 75,000 $125,000 — — — — $200,000
James Rubin ........ $215,000 — — — — — $215,000
Raymond Svider ..... $200,000 — — — — — $200,000
(1) The dollar amounts in column (c) reflect the aggregate grant date fair value of equity awards granted within
the fiscal year in accordance with the FASB ASC Topic 718 for stock-based compensation. These amounts
reflect the total grant date fair value for these awards, and do not correspond to the actual cash value that
will be recognized by each of the Directors when received. See Note A of the consolidated financial
statements in our Annual Report on regarding assumption underlying valuation of equity awards.
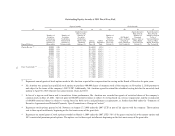
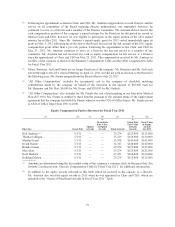
(2) The “Equity Compensation Paid to Directors for Fiscal Year 2011” Table that follows represents the
aggregate grant date fair value of awards of restricted stock granted to our Directors under the company’s
2007 LTIP in 2011. Annual awards are calculated by a dollar value that is then translated into restricted
stock based on the closing stock price on the date of grant. The per share price of the restricted stock on the
grant date of May 3, 2011 was $4.27. All restricted stock awards made to Directors were immediately
vested.
(3) As of December 31, 2011, there were no outstanding shares of restricted stock held by any Directors other
than Mr. Austrian who holds restricted shares in his capacity as Chair and CEO, and accordingly it is
reported in the Grants of Plan Based Awards in Fiscal Year 2011 table. Beginning in 2007, all annual grants
of equity to the Directors fully vest at the grant date. As of December 31, 2011, the following Directors held
the following number of restricted stock units based on our common stock: Marsha Evans 59,439, Myra
Hart 44,499, Scott Hedrick 52,696 and Thomas Colligan 35,129. Please see the table “Equity Compensation
Paid to Directors for Fiscal Year 2011” that follows for all equity granted in 2011.
(4) As of December 31, 2011, the following Directors held options to purchase the following number of shares
of our common stock: Thomas Colligan 0, Marsha Evans 19,368, Brenda Gaines 116,310, Myra Hart
106,625, Scott Hedrick 71,402, and Kathleen Mason 56,013.
(5) Except for the Directors who are representatives of BC Partners, the Directors receive annual compensation
of: (a) $75,000 in cash, and (b) the remainder of the annual retainer fee and chair fees, if applicable, in
restricted stock as discussed further in the “Director Compensation” section. The BC Partners Directors
received their 2011 compensation entirely in cash. In connection with the search for a new CEO, the Board
formed a Search Committee made up of Ms. Evans (Chair), Ms. Hart, Mr. Rubin and Mr. Austrian. The
Search Committee members, with the exception of Mr. Austrian, received cash compensation as follows:
Ms. Evans $25,000; Ms. Hart $15,000; and Mr. Rubin $15,000, which was paid to BC Partners. These
amounts are included in column (b).
78